Featured Article
Emily Garding | Apr 12, 2024
Get more precision while editing in ArcGIS Online using interactive tooltips to set your own editing constraints.

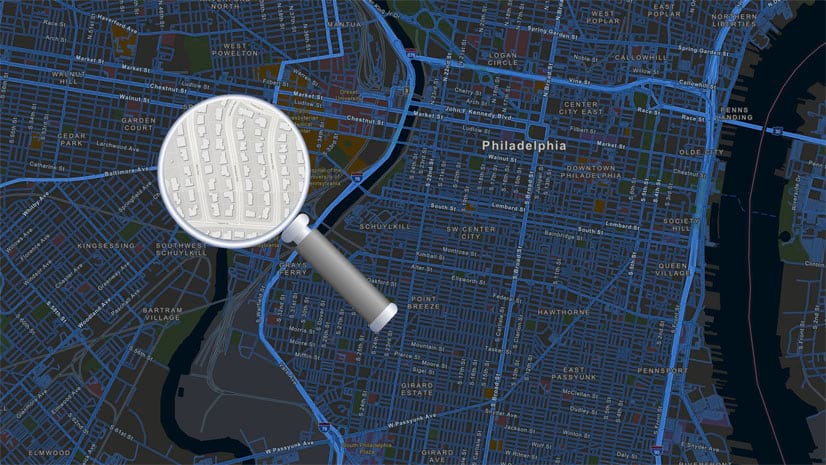
Shane Matthews | April 18, 2024
Esri's Basemaps continue to improve with over 300 new and updated communities, spanning 4 continents.
Bern Szukalski | April 11, 2024
By default the ArcGIS World Geocoding Service is the locator used across your organization. Here's how to configure and use a locator view.
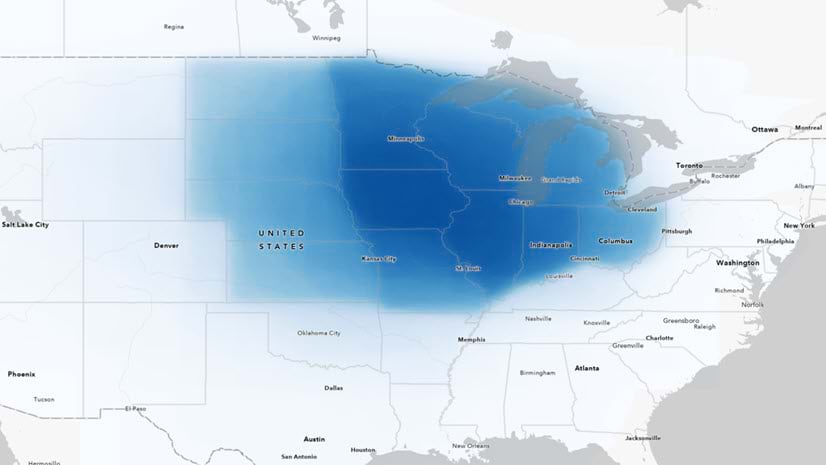
Multiple Authors | April 11, 2024
Answering regional geographers' favorite question: Where is the Midwest to you?
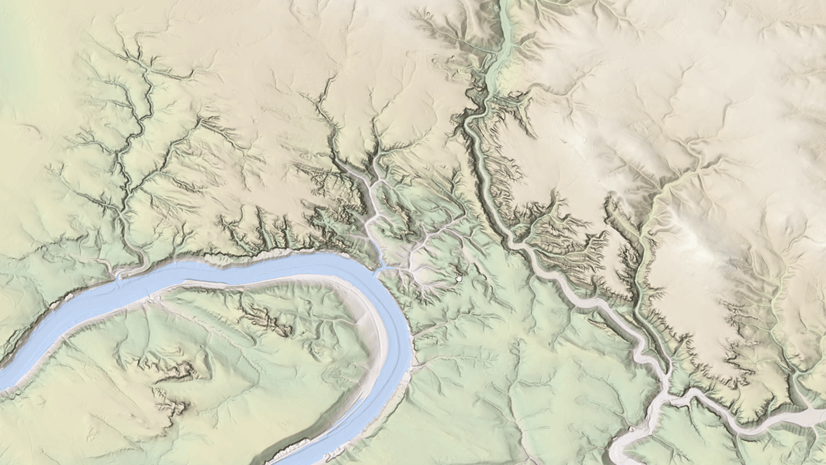
Rajinder Nagi | April 11, 2024
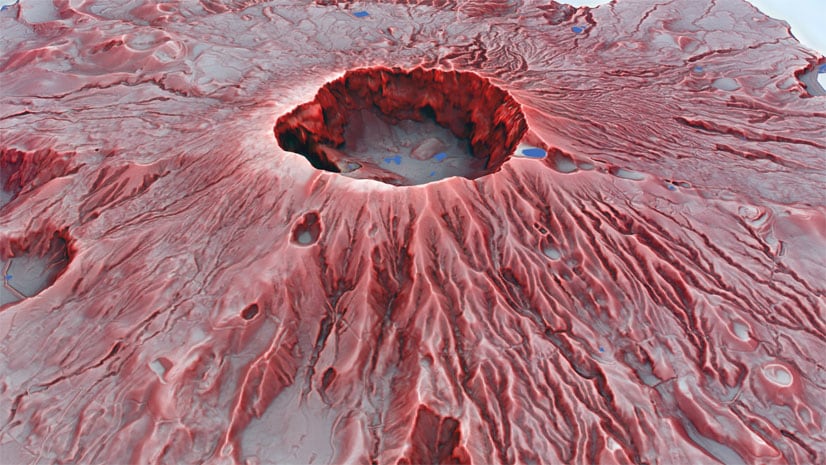
In April 2024, elevation layers have been updated with high-res datasets of Wales, New Zealand & German states of Bavaria, Saxony and Brandenburg

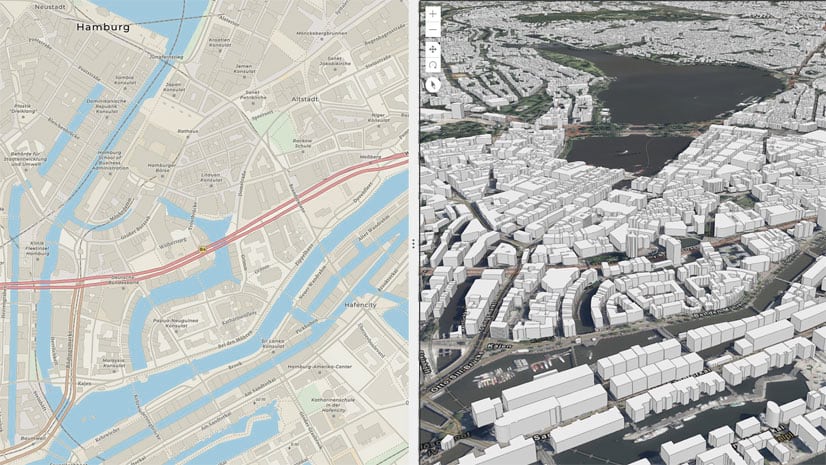
Raluca Nicola | April 10, 2024
A small hack for adding a watercolor basemap to a 3D city visualization
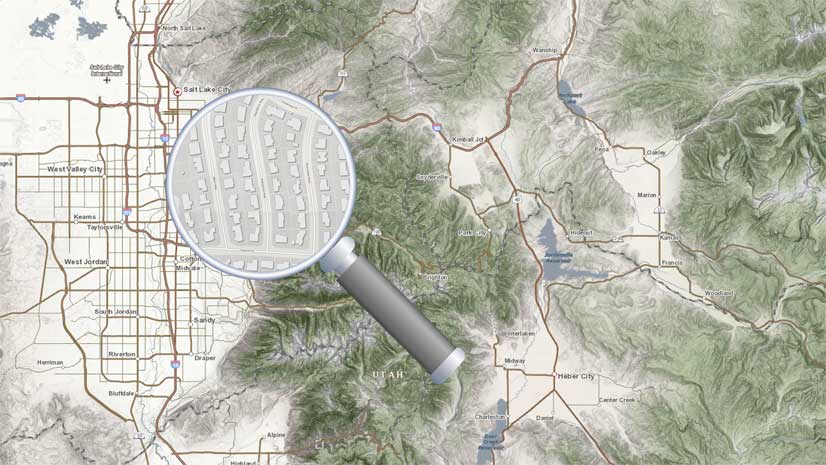
Bern Szukalski | April 8, 2024
Search in maps and apps uses locators configured for your organization, or layers and fields in maps. Here's how to configure them.
John Nelson | April 5, 2024
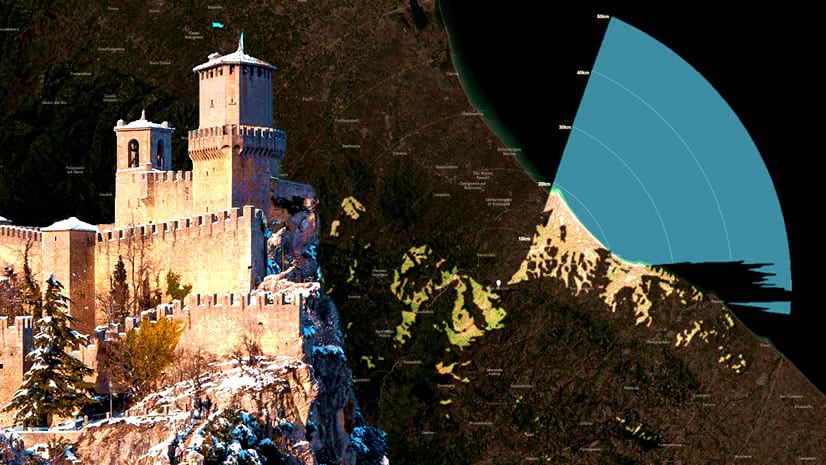
How to make a viewshed and, for bonus points, make it look like it's illuminating the map.

Bern Szukalski | April 3, 2024
Text elements are one of the ways you can add information to pop-ups. Here's the basics for creating effective text elements.
John Nelson | April 3, 2024
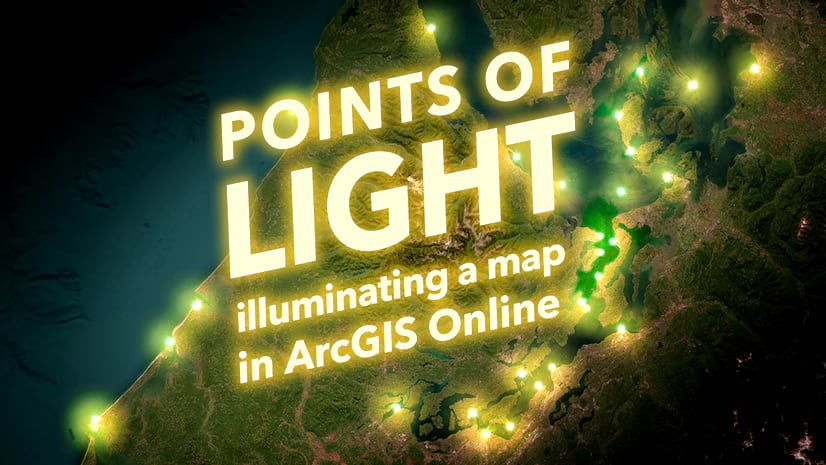
Light your map up, instead of covering your map up!

Bern Szukalski | April 2, 2024
Google Drive offers a way to store, share and manage files. Here's how to use those files in ArcGIS Online maps and content.

Bern Szukalski | April 2, 2024
When displaying photos or other images in ArcGIS Online web map pop-ups, it’s sometimes the small things that can make a big difference.

Bern Szukalski | March 30, 2024
Crafting great pop-ups is essential to a great map experience. Use color in pop-ups to clarify or emphasize what your map shows.

Bern Szukalski | March 30, 2024
You can add, share, and manage many types of items in ArcGIS Online, including photos and images. Here's how...
Cooper Thomas | March 26, 2024
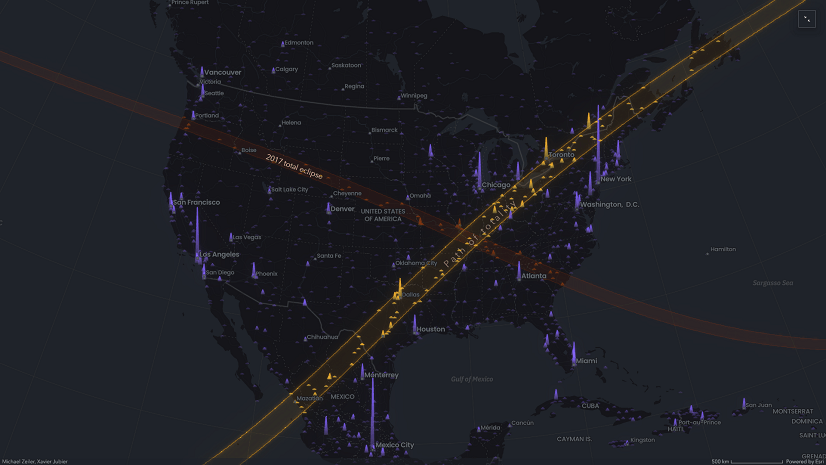
See how the StoryMaps team used Map Viewer's analysis tools to uncover insights about the path of the eclipse
Bern Szukalski | March 25, 2024
With lots of different types of content, Living Atlas can be leveraged in many ways (including ways you may not have thought of).
Bern Szukalski | March 25, 2024
Crafting good pop-ups is an essential part of map authoring and can transform a raw list of data into more meaningful information.

Bern Szukalski | March 24, 2024
Email can be sent directly from web map pop-ups using several different methods. Here's how...

Multiple Authors | March 21, 2024
Learn how ArcGIS supports the European Open Data Directive and get practical resources to start today.
Bern Szukalski | March 20, 2024
Take pop-ups to the next level using Arcade to perform calculations, manipulate text, evaluate logical statements, or return a block of content.

Bern Szukalski | March 18, 2024
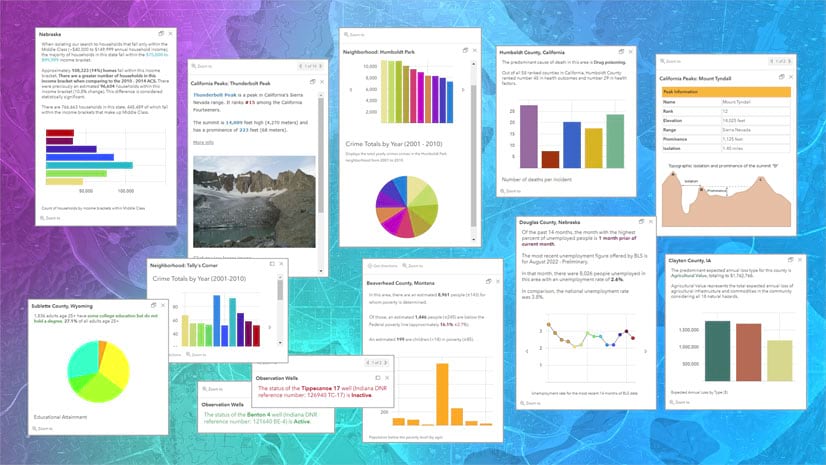
Charts turn numeric attributes into more meaningful information. This article shows how to configure them in pop-ups.
Amanda Stanko | March 18, 2024
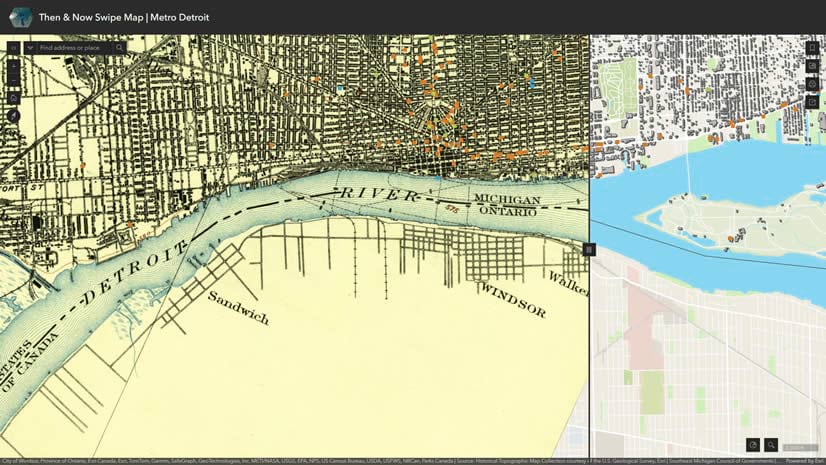
Create a Then & Now comparison swipe map using USGS Topo Map Explorer and Living Atlas data.

Steven Aviles | March 15, 2024
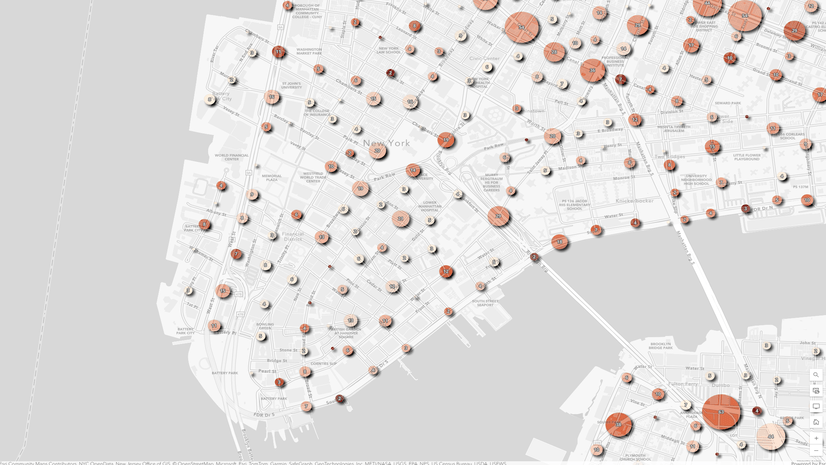
Tracking the adoption of electric vehicles in the U.S. from 2016 to 2022.
Russell Roberts | March 15, 2024
Check out how to use clustering and binning features in Map Viewer with the latest updates.
Bern Szukalski | March 14, 2024
A collection of ArcGIS Online apps that you can configure or use that let you swipe or compare multiple layers or maps.

Bern Szukalski | March 14, 2024
You've been busy adding items for others in your organization to use. Here's how to prevent accidental deletion of those items.