Before an election, citizens want to know where to vote. On election day, voters want to know how long the wait is to cast a ballot so they can choose the best time to vote. As the polls close, people want to know who won and see detailed election results.
Making this information easily accessible can increase participation and engagement in the democratic process.
ArcGIS now includes a series of recently released solutions that enable governments to quickly deploy apps that inform citizens about where to vote, how long the wait to vote is, what were the results of an election and who is currently in an elected office. Organizations that license ArcGIS can download these election solutions at no additional cost.
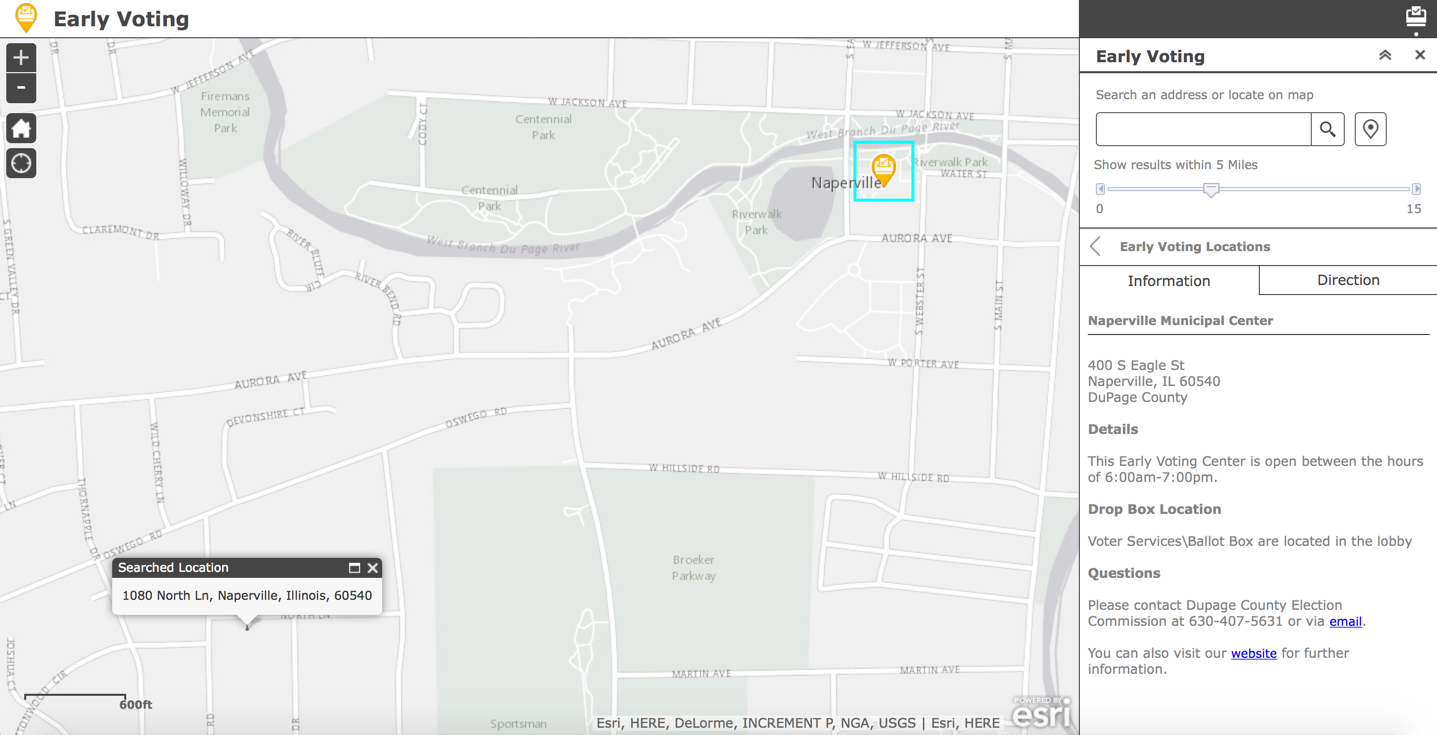
Where do I vote?
Early Voting enables citizens to see early voting locations and hours, find locations closest to them and generate driving directions.
Election Polling Places helps citizens find where they can vote on election day. Election Polling Places shows the location of polling places, allows citizens to input their address or click a location on a map to see the assigned polling place and can provide driving directions. The app can also be configured to show detailed information about polling places such as precincts served, voting hours and ADA accessibility.
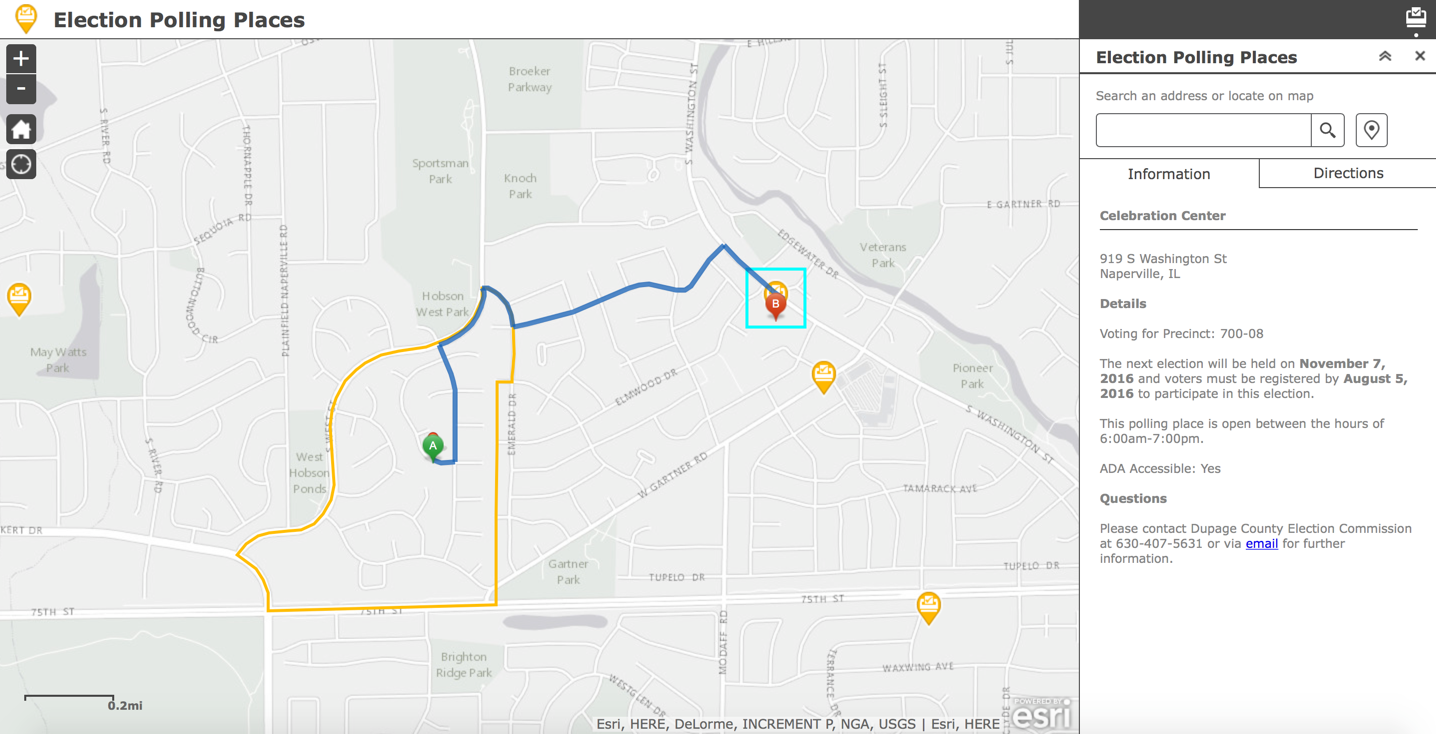
Both the Early Voting and Elections Polling Places apps can be accessed by citizens through a web browser on a tablet, smartphone or computer.
How long will I wait to vote?
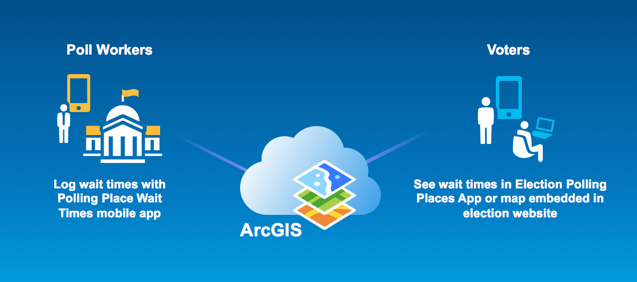
Polling Place Wait Times is a mobile application that runs on smart phones and tablets. Poll workers use the app on smart devices to log wait times at their assigned polling location.
Wait times can be shared with citizens through the Election Polling Places app or in a map embedded in an official election website. Informing citizens about polling place wait times can help reduce peak surges in voter turnout by smoothing voter flow throughout the day.
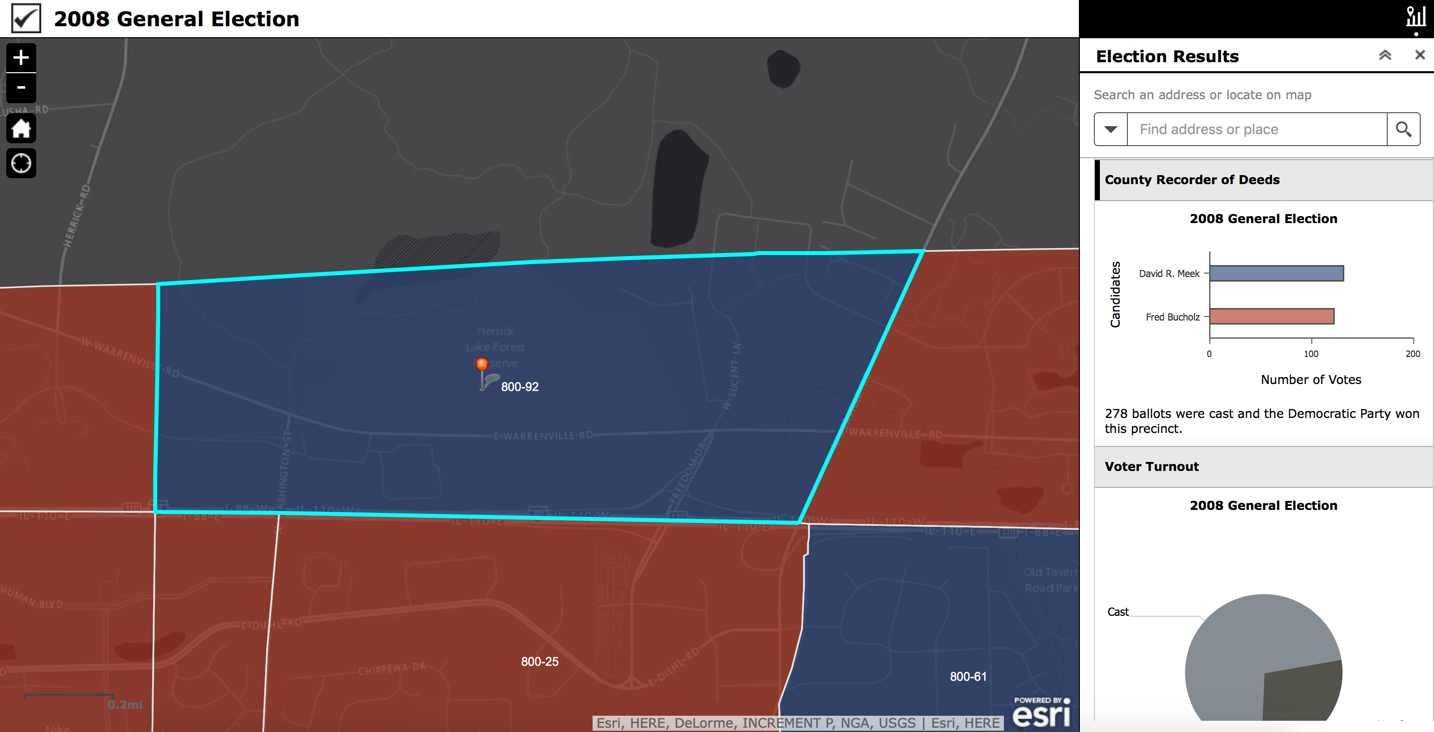
Who won the election?
Election Results can be used to share election night results and historical results from previous elections. Election Results enables people to visualize and understand election results better than tabular information.
My Elected Representative tells citizens who currently represents them in local, state and federal elected offices. The app also provides information about how to contact elected officials. Through the configuration process organizations can choose to put all levels of elected representation in a single app or create multiple apps for each level of representation.
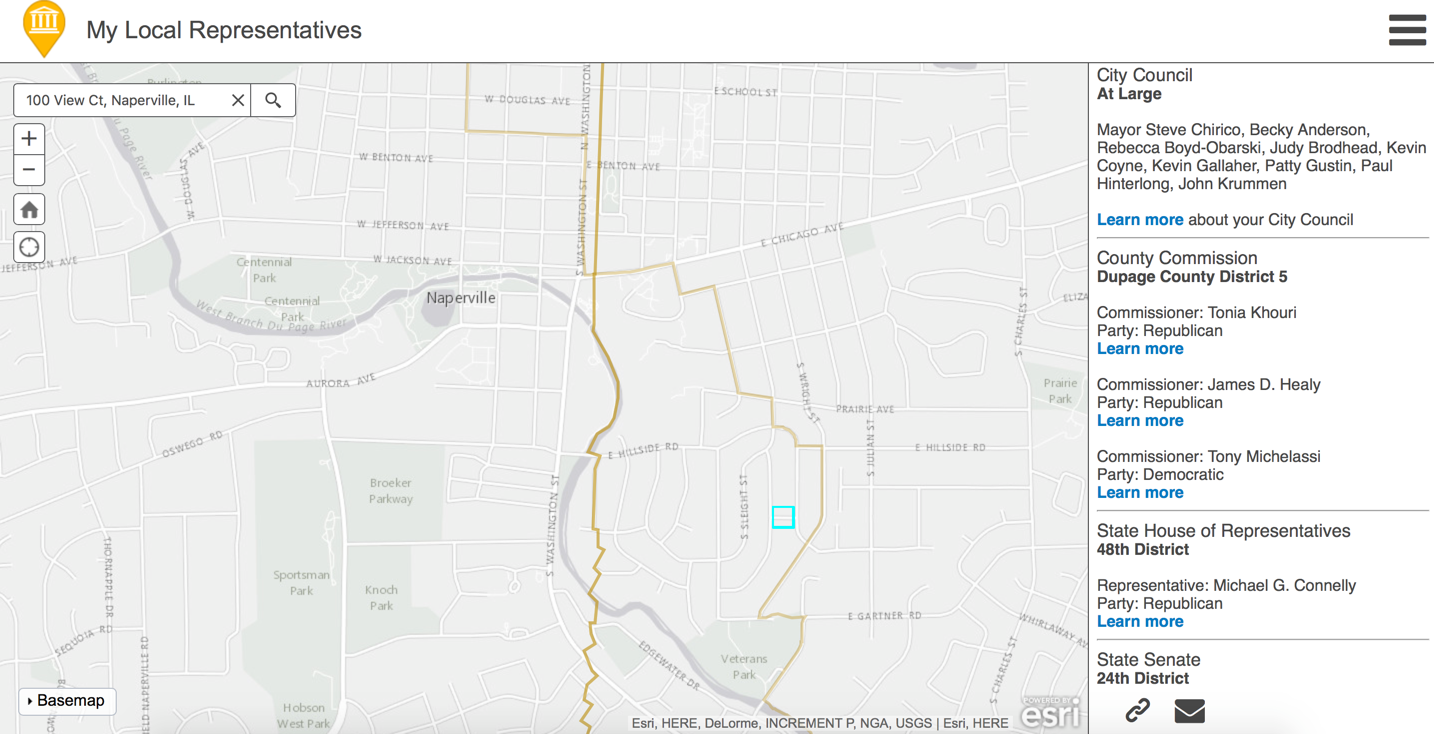
Both Election Results and My Elected Representative are web apps that can be accessed on mobile devices and computers.
Be Ready
If your organization supports elections extend your ArcGIS implementation now to better inform citizens and foster a more inclusive democratic process during the next election.


Article Discussion: