ArcGIS Online imagery basemap was updated to include more recent global imagery, initial states of 2015 NAIP imagery, new contributor content, and additional imagery at the newly expanded largest map scales. The Arctic Imagery basemap was also updated. View this map tour to see areas of the map that have recently been updated.
World Imagery Global Small Scales
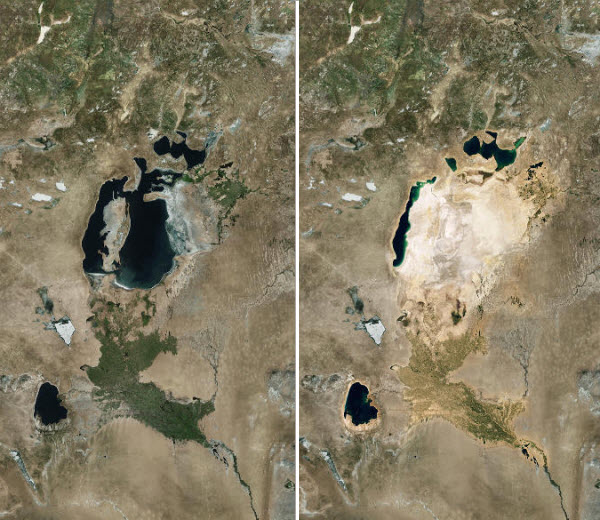
Our most popular basemap, World Imagery, has areas refreshed with TerraColor Global Satellite Imagery at the global small scales (~1:591M to ~1:577K). Two of the many areas that changed in this 15m resolution imagery are highlighted here. The remains of what was once the Aral Sea along the Kazakhstan-Uzbekistan border show the effect of diverting the water for agricultural irrigation. The eastern basin is now called the Aralkum desert.
Previous extent of the Aral Sea (left). More recent view, now in the basemap (right).
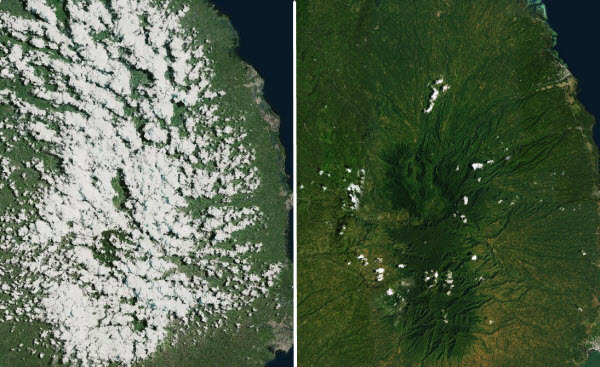
Another area of improvement in the imagery basemap is the reduction of cloud cover. This image shows northwestern Mindanao, Philippines, in a “before and after” snapshot. The imagery basemap now contains less cloud cover (right) over a number of areas including the islands in southeast Asia.
2015 NAIP Imagery
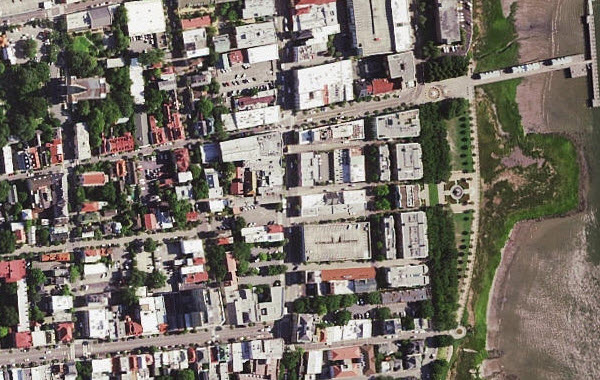
We also added 2015 National Agriculture Imagery Program (NAIP) imagery from the USDA Farm Services Agency for several states. This 1m update covers Delaware, Maryland, New Jersey, South Carolina, and Washington, DC. The new imagery is viewable at scales ~1:36K to ~1:4K. In future releases, we plan to add the other states flown in 2015 to our World Imagery basemap.
Charleston, SC (2015, NAIP 1m resolution)
Community Maps for Imagery
Contributions to the Living Atlas of the World through the Esri Community Maps for Imagery program enhance content for 11 communities in this release. We welcome four brand new contributors and seven updated communities. Most areas updated add content cached to the recently expanded scale levels 20 & 21.
With the new contribution from Toronto, you can easily count the shark-shaped custom four foot square, 110-pound slabs on the roof of Ripley’s Aquarium of Canada.
Toronto, Ontario, (0.08m) at Level 19

And at Level 21.

View the map tour to see these contributors
New community contributors:
Beaupré, Quebec (0.15m to Level 20)
Pontiac, Quebec (0.30m)
Toronto, Ontario (0.08m to Level 21)
Wyandotte County, Kansas (0.30m to Level 20)
Updated/expanded contributors:
Lucas County, Ohio (0.07m to Level 21)
Rio Rancho, New Mexico (0.15m to Level 20)
Rouyn Noranda, Quebec (0.20m)
St. Johns County, Florida (0.15m to Level 20)
Tompkins County, New York (0.12m to Level 20)
Ventura, California (0.07m to level 21)
Yakima, Washington (0.15m to Level 21)
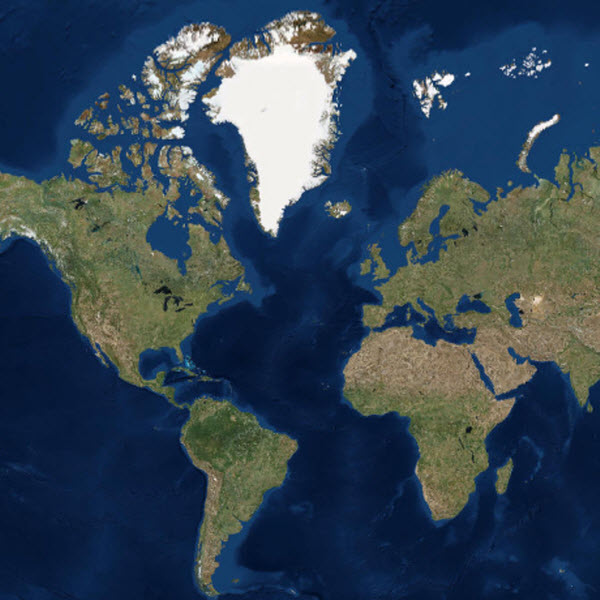
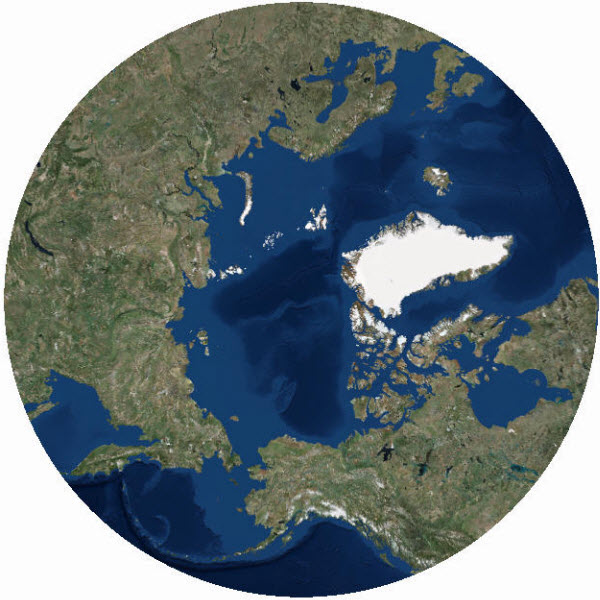
Arctic Imagery
Additionally, we updated the Arctic Imagery map with the same TerraColor updates as the Web Mercator global small scale map detailed at the beginning of this blog. This is a separate basemap layer mapped to a stereographic polar projection. It displays from the northern pole down to 50 degrees north latitude. We are also working on a polar Antarctic imagery basemap forecasted to be released in early 2016.
Living Atlas Community
How do I Use? Combine content from the Living Atlas with your own data. Create powerful new maps and applications!
How do I contribute? Join the growing community of Living Atlas of the World contributors. There are two ways to contribute!
Learn more about the ready-to-use content that is available in the Living Atlas of the World, including how you can contribute your maps and data.
Living Atlas Newsletter: This newsletter will keep you and other members of the Living Atlas user community informed through success stories, examples of applied use, visibility of new content, announcements about events, and other useful resources and information. Subscribe to the Esri News for the Living Atlas Community. You can have the newsletter sent right to your inbox by subscribing here.
Share your story: How has contributing to the Living Atlas Community benefited your organization and community? Has your participation helped meet a particular challenge? Has your applied use of Living Atlas content solved a problem or help meet a goal? Email me at smatthews@esri.com so we can promote your success.
Feedback
If you have previously used the World Imagery Map, you may need to clear your cache in order to see the updates.
If you have feedback on content, try our Imagery Map Feedback web map.
If you have other feedback or comments, please post them to the ArcGIS Online Discussion Group and the Living Atlas Discussion Group on GeoNet.

Article Discussion: