It’s time to refresh your browser – ArcGIS Online has been updated with the following new features and enhancements. This release includes updates and new capabilities for organization administration, smart mapping, configurable apps, content, and more. For additional details see the What’s new help topic.
Smart Mapping
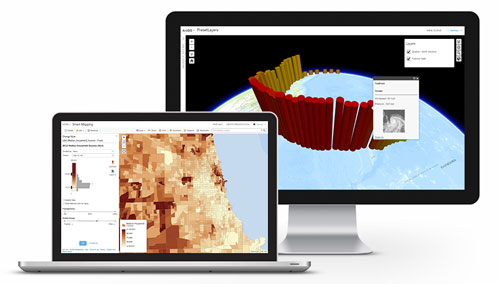
Smart mapping provides data-driven tools that enable you to explore your data to unlock information and easily author visually appealing web maps. When feature layers are added, the data is analyzed and appropriate layer styling options are presented in a streamlined user experience appropriate for your data.
With this update, new map styles have been added that enable you to visualize and explore multiple attributes in your data. New styles include:
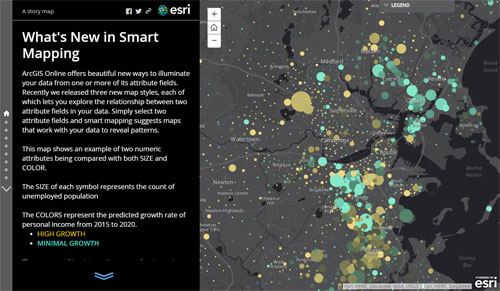
Color & Size: Map the relationship between two numbers, such as poverty rate and the the number of single-parent households. See an example.
Unique Symbols & Size: Map a count attribute using a unique color for a value in another field. For example, show the number of those who have a bachelor’s degree by county. See an example.
Compare A to B: Enables you to map the ratio between two numbers and express that relationship as percentages or simple ratios. For example, map the relationship of corn vs. wheat harvested by county. See an example.
Learn more about what’s new using the Smart Mapping Story Map.
For more information see:
- What’s New in Smart Mapping (November 2015)
- Smart Mapping – Mapping made easy
- Introducing Smart Mapping
Map & Scene Viewer
Use the map viewer to search for content and create maps. You can add these maps to your apps, embed them on websites, and share them with others. You can also view and create 3D maps with the scene viewer. The following are updates for this release.
Map viewer
- Displaying imagery layers has been enhanced with improved query capabilities for pixel values and an updated multidimensional slider.
- When browsing Living Atlas layers you can now choose whether or not to find layers based on your current map extent.
- When creating labels and adding map notes text, you can now add a halo outline.
- You can now reorder bookmarks, providing more control during the authoring and editing of maps.
- Directions has been enhanced to provide additional options to finding destinations. If your organization has configured custom geocoders or when the map includes searchable layers, you can select one of these resources to search for destinations for your route.
- The map viewer has been enhanced to honor the time interval and time-interval units configured on time-aware layers.
Scene viewer
- You can now choose to display your data within two different scene environments: a global scene or local scene depending on which is more appropriate for your needs. Local scenes also allow easy visualization and navigation underground.
- Scenes now support shared ownership groups, enabling collaborative workflows on the same scene.
- You can add outlines to point symbols, including options for color, width, and transparency.
- Display effects include the starry sky at night, and sunrise and sunset.
Story Maps
Story Maps enable you to harness the power of maps and geography to tell your story. They combine authoritative maps with narrative text, images, and multimedia using an interactive builder; choose from a variety of configurable apps.
Create Story
Create Story is the quickest and easiest way to author your story. Pick an App from the list, or Ask the Pros for a suggestion to meet your story needs.
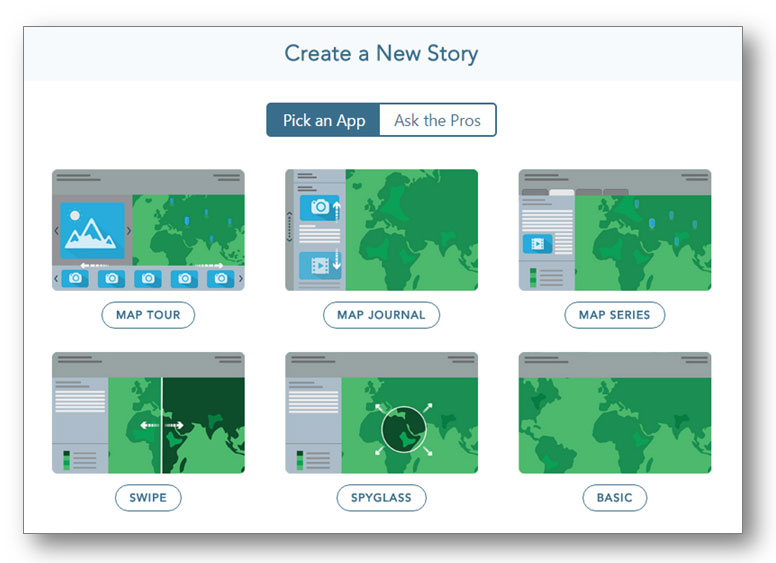
Create Story can be found in several places; on the main Story Maps home, on the Apps page, and also on My Stories. Open any of those locations and look for the Create Story button. See Using Create Story to choose a story map for more information.
Create and edit web maps as you build your story map
You can now create and edit web maps while in builder mode for Story Map Journal and Story Map Series. You can open the map viewer directly while in builder mode to author maps for your story. This capability streamlines story map authoring and eliminates the need to author all web maps in advance.
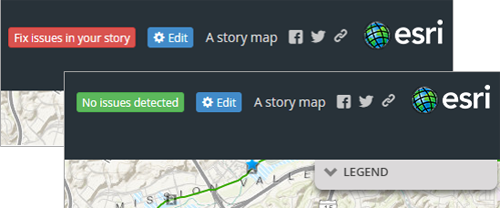
Discover, troubleshoot, and fix issues on-the-fly
The builders for Story Map Journal and Story Map Series now automatically check your story for any issues, and enable you to troubleshoot and fix issues on the spot. A notification appears if issues are found, and the Share dialog will also list any issues and provide suggestions for fixing them. In addition, when you open an existing story map you own it is checked and a notification appears indicating status.
Updated Story Map Basic
The previous version of Story Map Basic has been retired (existing apps will continue to use it) and a new version takes its place. The new app supports search using locators and/or searchable feature layers. Subscription (premium) content contained in the web map can now be shared publicly with the app. In addition, there is more control over the look and feel of the app including the ability to add a logo to the header with a URL, and more color options for various components of the user interface. To use these new features, re-share your map using the new version. Learn more…
For more information see What’s New in Story Maps (November 2015).
Configurable Apps
Configurable apps make it easy to share your maps with easy-to-use templates, enabling you to create custom-configured applications without programming. You can make and share apps by choosing from a variety of app templates.
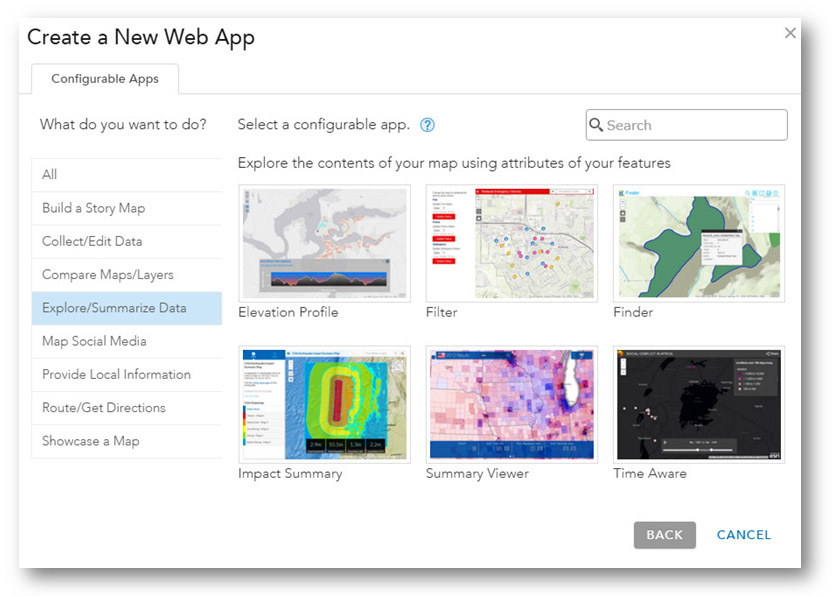
Redesigned app gallery
The app gallery has been redesigned to make it easier to choose the configurable app you want to use. You can filter based on the purpose of the app and search to refine the set of apps you see.
New Minimalist app
Minimalist is a new and simple map viewer with a minimalist user interface designed to provide focus on the map. By default it presents the map with only a scale bar and zoom slider, but can be configured to display a content panel that presents a legend, map details, or pop-up info.
Other updates to configurable apps
- Crowdsource Polling has been enhanced and is now available in the Esri Featured Apps section of the Gallery.
- Both Crowdsource Polling and Crowdsource Reporter now support sign-in via Facebook, Twitter, or Google+.
- A new version of Elevation Profile is introduced, delivering a simplified design with a customizable elevation chart.
- Basic Viewer has been enhanced to better support use by individuals with disabilities (in alignment with Section 508) and also adds an optional splash screen.
- Legend and Twitter have been retired, use Simple Viewer and Public Information instead.
For more information see
Content
ArcGIS Online includes a variety of ready-to-use maps, apps, and layers that you can combine with your own data to create new maps and applications. This Living Atlas includes beautiful and authoritative maps on thousands of topics, and includes maps and data from Esri and thousands of other organizations. New for this release:
Enhanced basemap resolution
Imagery, Streets, and World Topographic basemaps have been updated to add additional levels of detail (increased from L19 to L23), exposing more detailed data where available. For more information see:
Additional levels of detail also facilitate overlaying high resolution data for uses such as authoring indoor maps. Examples include Esri Campus Map, Ontario Mills Shopping Center, Naperville Municipal Center, and Naperville Water Distribution.
New Ocean Content
Nine new layers have been added for oceans, including sea surface temperature, seafloor temperature, seafloor dissolved oxygen, seafloor salinity, and more. See New Ocean Content Available in the Living Atlas of the World for details and more information.
World Hillshade basemap
World Hillshade is now available as a basemap layer that you can add to your map, or include in your organization’s custom basemap gallery. This layer was previously only available as the Multi-Directional Hillshade dynamic raster service.
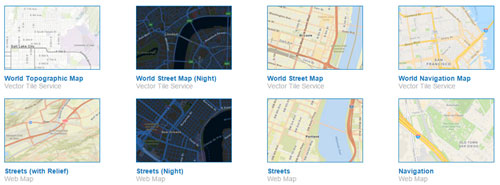
Esri vector basemaps (beta)
Beta versions of Esri vector basemaps are available as vector tile layers and maps for display in the map viewer, and for use in your own custom basemap galleries. A vector tile layer references a set of web-accessible vector tiles and the corresponding style for how those layers should be drawn. View available basemaps in the Vector Basemaps (Beta) group.
Vector tiles are similar to image tiles, but they store a vector representation of the data. Client-side drawing of vector tiles allows for vector tile layers to be customized and drives dynamic, interactive cartography. Developers can programmatically customize the style and the contents of the map, such as turning a layer on or off. For more information see:
Real-time streamflow additions
Real-time streamflow information from Australia, Germany, and New Zealand is being added to Live Stream Gauges (anticipated completion date – December 2, 2015). The Live Stream Gauges map and layer contains real-time measurements of water depth from multiple reporting agencies recording at sensors across the world, and updates itself every hour.
Other content updates
Other content updates, some in progress, include the following:
- World Street Map, Light Gray Canvas, Dark Gray Canvas, and Reference layers have been updated with more recent data for North America.
- Demographic maps for over 20 countries including Canada have been updated with more current data.
- The World Imagery map has been updated at small-to-medium scales with the latest available 15-meter TerraColor imagery, with several updates in Arctic region, Asia, and other parts of world using recent Landsat 8 imagery.
- The Arctic Imagery map has been updated with the latest imagery.
- A new Imagery map in Geographic Coordinate System (GCS) WGS84 projection is available. The map includes the same imagery as the World Imagery map (which is in Web Mercator projection) with added coverage in the polar regions. This new imagery map is designed to support 3D display in apps such as ArcGIS Earth as well 2D display for apps when GCS is the preferred coordinate system.
- World Topographic and Light Gray Canvas now include detailed content for South Korea.
Organization Administration
ArcGIS Online provides tools for administrators to effectively manage and monitor members, assets, and resources within the organization. New capabilities introduced with this release include the following.
Credit budgeting
Administrators now have better management of credit consumption by individual members. Administrators can allocate specific quantities of credits to some or all organization members. This is useful for managing credit consumption for tasks such as batch geocoding, network analysis, geoenrichment, using demographics, and tile generation.

The credit budgeting does not apply to credits used for storage of features, files, and tiles or app proxy usage, but is intended for managing individual member consumption. For more information see Configure credits and What’s New in Managing Organization Expenditures (November 2015) – coming soon!
Organization status reports
Credit usage statistics can now be downloaded as a CSV file enabling administrators to use other software to view and analyze usage data. A new series of reports for apps are available, including details for apps published by the organization, the app creation tools used, and detailed reports on member sign-in activity, including the frequency and patterns of usage by members. The reports also detail the most popular apps published by the organization, and credit utilization information for apps that are using premium content.
Other Administrative Enhancements:
- Administrators can now assign roles in bulk to existing members, streamlining managing a large organization. See Configure roles.
- AppStudio for ArcGIS Standard is now managed via Add Licenses.
- Adminstrative contacts are now configurable. These contacts are listed in automatic email notifications that are sent to members when they request password resets, user name assistance, credit allocations, or modifications to their account. See Configure general settings.
- The map viewer, Web AppBuilder, and the configurable apps now fully support editing feature services secured with web-tier authentication. Additionally, OGC WMS and WMTS secured with web-tier authentication such as Basic or Digest access authentication are now supported in the map viewer, Web AppBuilder and the configurable apps. To take advantage of this support, administrators can configure trusted servers that allow ArcGIS Online to automatically pass through credentials.
- ArcGIS Online has enhanced its security compliance for enterprise logins, now supporting encrypted Security Assertion Markup Language 2.0 (SAML) and the verification of self-signed certificates from identity providers. See Set up enterprise logins.
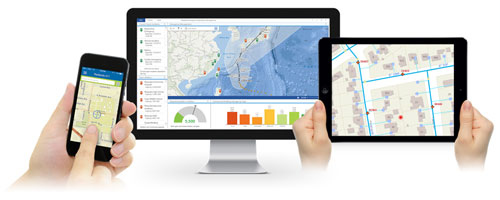
ArcGIS Apps
ArcGIS Apps deliver tools that help you support focused workflows and day-to-day tasks. Using these apps, you can track assets, collect data in the field, create operational dashboards, and more. The following are updates to ArcGIS apps for this release.
Collector for ArcGIS
Use Collector for ArcGIS on your smartphone or tablet to collect and update information in the field, whether connected or disconnected. Updates include:
- A new set of data collection templates is available for creating hosted feature layers for use with Collector for ArcGIS. See Publish an empty hosted feature layer.
- Support for Windows 10 devices.
- Support for filtering feature types and coded values.
- Ability to configure photo resolution (iOS platform).
- Support for pushing edits only during synchronization.
See Collector for ArcGIS help for more information.
Operations Dashboard for ArcGIS
Configure Operations Dashboard to provide a common view of the systems and resources you manage. Monitor real-time data feeds for large events or day-to-day operations on your desktop or tablet device. Updates for this release cover both Windows and browser apps, see Operations Dashboard for ArcGIS help for more information.
Navigator for ArcGIS
Navigator for ArcGIS is a mobile app that gets your field workforce where it needs to be. Use the data provided or your own data to search and navigate directly to your organization’s assets. Updates include improved support for iOS 9 and enhanced support for SAML-based logins. See Navigator for ArcGIS help for more information.
Esri Maps for SharePoint
ArcGIS Maps Silverlight web part will be deprecated following this release, the JavaScript web part contains many enhanced features not available for Silverlight. See Esri Maps for SharePoint help for more information.
Survey123 for ArcGIS (Beta)
Survey123 for ArcGIS is available in beta. Survey123 is a simple and intuitive form-centric data gathering solution for creating and analyzing surveys in three easy steps. You can create smart forms with simple and sophisticated features, equip field workers with mobile devices to capture data in any environment, and quickly analyze the results to make actionable decisions. For more information see Survey123 for ArcGIS.
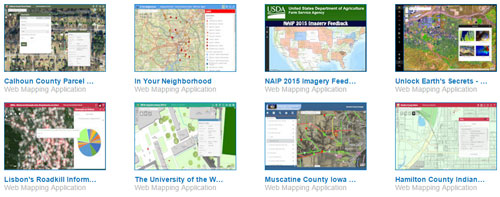
Web AppBuilder
Web AppBuilder for ArcGIS provides a framework for creating responsive HTML/JavaScript apps that run on any device, no coding required. Choose from a collection of ready-to-use widgets to build your app, and use configurable themes to customize their look. Apps can be hosted online or from your own server, and can be saved as custom templates to extend your organization’s app gallery.
For examples, view the Live Sites Showcase.
Updates
Web AppBuilder and several existing widgets have been updated with the following new features and capabilities.
- The app state, including map extent and layer visibility, is now automatically saved when you close your browser.
- Web-tier secure service from ArcGIS for Server is fully supported.
- Six new URL parameters enable you to find location or feature, supply login, query feature, add point, switch locale, and specify WKID to zoom or pan the map.
- The Search widget has options to add placeholder text for all search sources and search by current map extent.
- The Attribute Table widget updates layers accordingly when they are changed in the map.
- The Edit widget now carries over the editable attributes configured in the map.
New Widgets
Several new widgets are available, including the following:
- Feature Report leverages the data validation capabilities of the ArcGIS Data Reviewer for Server extension to “redline” features that are missing, mis-coded, or incorrectly positioned. It enables you to collect and manage data quality feedback from users.
- Reviewer Dashboard works with the reporting capabilities of the ArcGIS Data Reviewer for Server extension. It displays data quality result statistics as infographics and pie and bar charts to summarize data quality issues identified in your data.
- Batch Attribute Editor allows you to simultaneously edit multiple attributes.
- Image Measurement allows you to perform measurements on image services with mensuration capability. Mensuration is a method of applying geometric rules to find the lengths of lines, areas of surfaces, or volumes using information obtained from lines and angles.
- Batch Attribute Editor enables you to select multiple features and update common attributes at once.
See What’s New in Web AppBuilder for ArcGIS (November 2015) and the the Web AppBuilder for ArcGIS help for more details.
For More Information
For more information on this release, and previous releases, view the What’s New help topic. Monitor the ArcGIS Online blog for additional updates and more details on topics covered here.


Commenting is not enabled for this article.