 by Kenneth Field, Senior Cartographic Product Engineer
Standard techniques for representing terrain, like a hillshade, are adequate for many applications, but you may want to represent terrain under different lighting conditions, or perhaps use more artistic techniques. In these cases you might need to go a little further than creating a simple hillshade. For this reason (and because we like making tools that extend what we can do!) we’ve built a new toolbox, called Terrain Tools, that helps you take your terrain mapping to new heights.
Cartographic research often develops techniques, models and tools that supplement or extend what you find in software out-of-the-box. They are often difficult to find, hidden in journal articles or cumbersome to implement. We’ve brought together some of these ideas and workflows in the Terrain Tools toolbox that provides capabilities for creating alternative terrain representations in ArcGIS (ArcMap and ArcGIS Pro). Terrain Tools are designed to extend your out-of-the-box toolkit for representing terrain in GIS by encouraging you to be more creative; how to think more critically about design choices; and how to go beyond the defaults.
You can download a zip file from ArcGIS Online that contains the toolbox, sample data, documentation and also an ArcMap Map Document and ArcGIS Pro Project. The Map Document and Pro Project also include results layers so you can see how the tools work before you use them on your own data. It’s important to note that the sample results show the results of running the tools using the default output. They are a starting point and many of the tools give you the flexibility to modify parameters and customize your own output. The documentation is in workshop format that includes discussion of each tool and instructions for use. Because the tools are written in Python they can be viewed, modified and used as a starting point for further development.
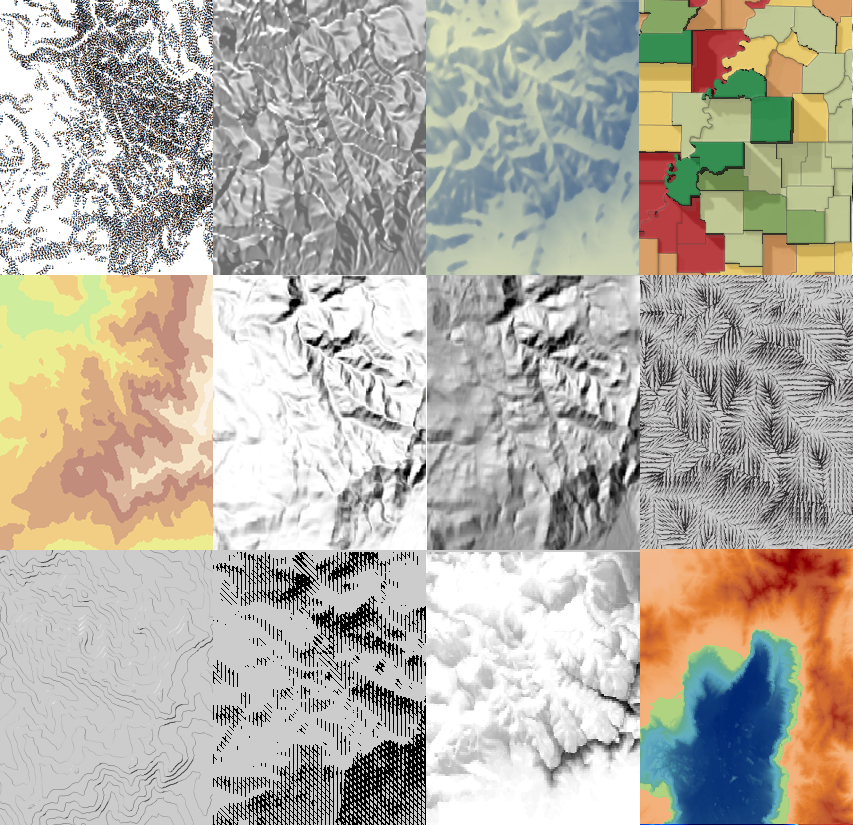
Here’s a brief look at some of the output you’ll get from running Terrain Tools.
Terrain Tools incorporates a few previously available tools which were available as models (built originally using ModelBuilder). They have been rewritten and optimized as Python scripts which improves stability and speed of processing. Additionally, a range of new tools have been either written (from the original published algorithms) or optimized as Python scripts from code samples.
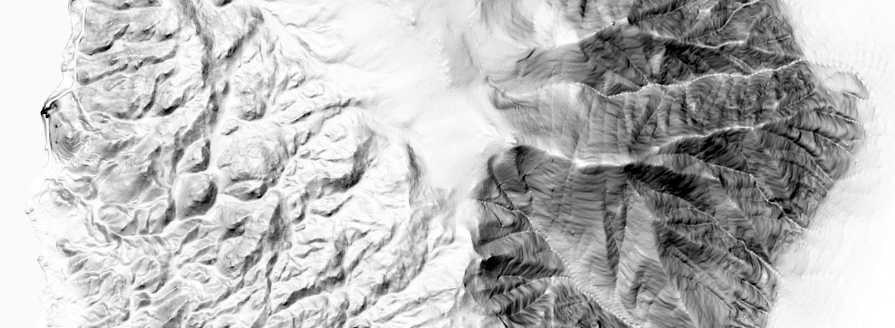
One of the highlights of Terrain Tools is the new Cluster Hillshade which provides you with the ability to make spectacularly detailed and artistic hillshades with your own data. This is just about as close as you can get with an automated process to classic hand-drawn hillshading – and all from just a Digital Elevation Model input and a click of a mouse.
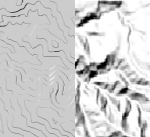
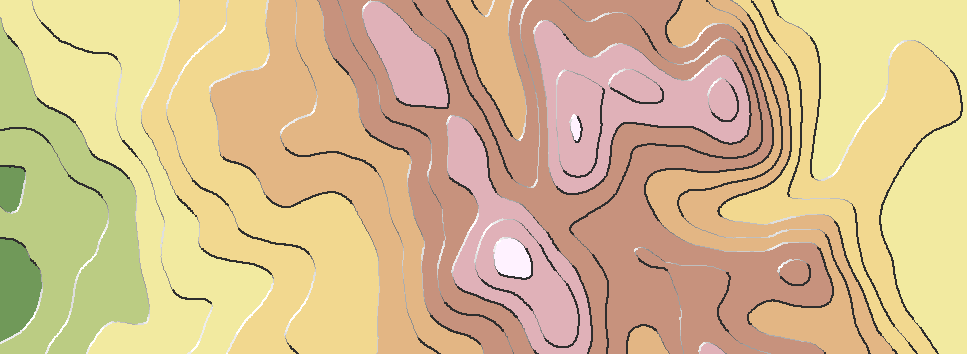
The Tanaka method for creating Illuminated Contours and Filled Contours are also included, here depicted one on top of the other:
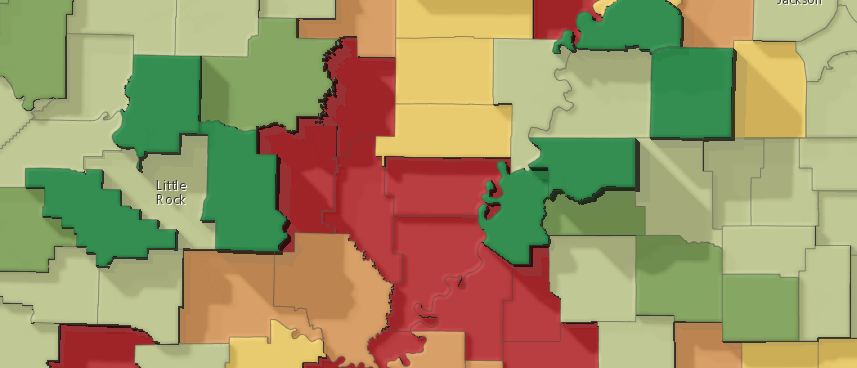
Thematic maps haven’t been ignored. It’s perfectly possible to run the tools for any input raster (e.g. a statistical surface rather than a DEM) but there’s also a specific 3D Choropleth tool, useful for adding depth to a choropleth, encoding a second piece of information or as a way to see variation within a single class interval:
There’s plenty more tools to explore and, of course, the scripts are entirely open to being customised further. Here’s the full list of what’s included in the Terrain Tools sample:
Multi-Directional Oblique Weighted (MDOW) hillshade
Produces a hillshade that emphasizes oblique illumination on all surfaces by using more than one illumination azimuth
Swiss Hillshade
Builds and then combines several hillshades to give a resulting yellow-blue Swiss hillshade effect
Cluster Hillshades
A suite of three tools that uses k-means clustering to create a seamless change of local lighting conditions throughout the generation of a hillshade to produce stunning results
Sky Models
Builds multiple hillshades with varying azimuth, zenith and intensity of light source and combines them in a weighted output to create hillshades under different lighting conditions with some dramatic effects
Historic Dots
Creates and symbolizes contours using an historic dotted line symbol and modifies the overall appearance by removing contours for low slope angles
Filled Contours
Creates and symbolizes nested polygons such that the boundary lines demarcate areas of equal elevation value
Illuminated Contours
An analytical version of the Tanaka method of symbolizing contours that includes colouring and varying the thickness of illuminated and non-illuminated contour lines
Hachures
Creates an output that illustrates three-dimensional topography on a two dimensional map using hachures that symbolize slope and aspect
Shadow lines
An artistic drawing method in which lines of variable thickness and orientation approximate tonal variations associated with shading and shadowing
Chromastereoscopic tinting
A technique that encodes depth values by colour and which, when viewed through glasses that contain minute prisms, gives a holographic 3D view of the data. Glasses not included!
3D Choropleth
Breathes life into the choropleth mapping technique by building multiple hillshades that emphasize differences across the statistical surface
We’re indebted to the assistance of a number of key researchers who’ve assisted in the development of these tools. You’ll find references and links to their original work in the documentation and the tool help.
Get the tools here via ArcGIS Online.
We hope you enjoy using these tools whether you’re looking for a more advanced hillshade or something a little more artistic. Use them as a starting point for inspiration and share your efforts!

Article Discussion: