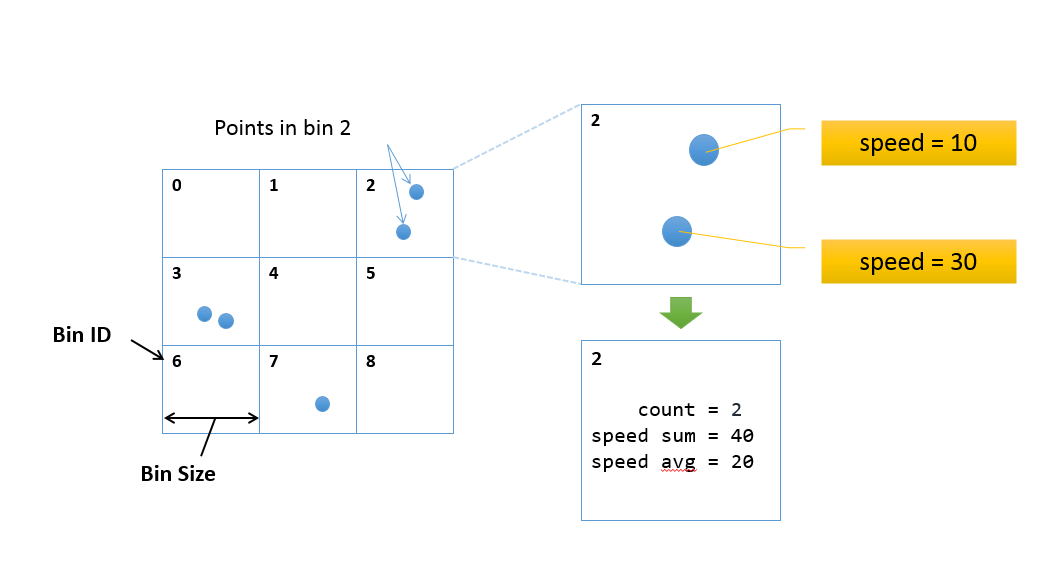
The Big Data team is excited to offer a new tutorial on spatial aggregation (sometimes called spatial binning). Spatial aggregation is extremely useful in summarizing big data to gain a meaningful snapshot of patterns in your data. Spatial aggregation works by creating square bins of a user specified size, like this:
The result looks similar to a raster, although they are really square polygons. Here is an example of what the results look like. If you wanted to draw 170 billion points in ArcMap, it would look something like this:
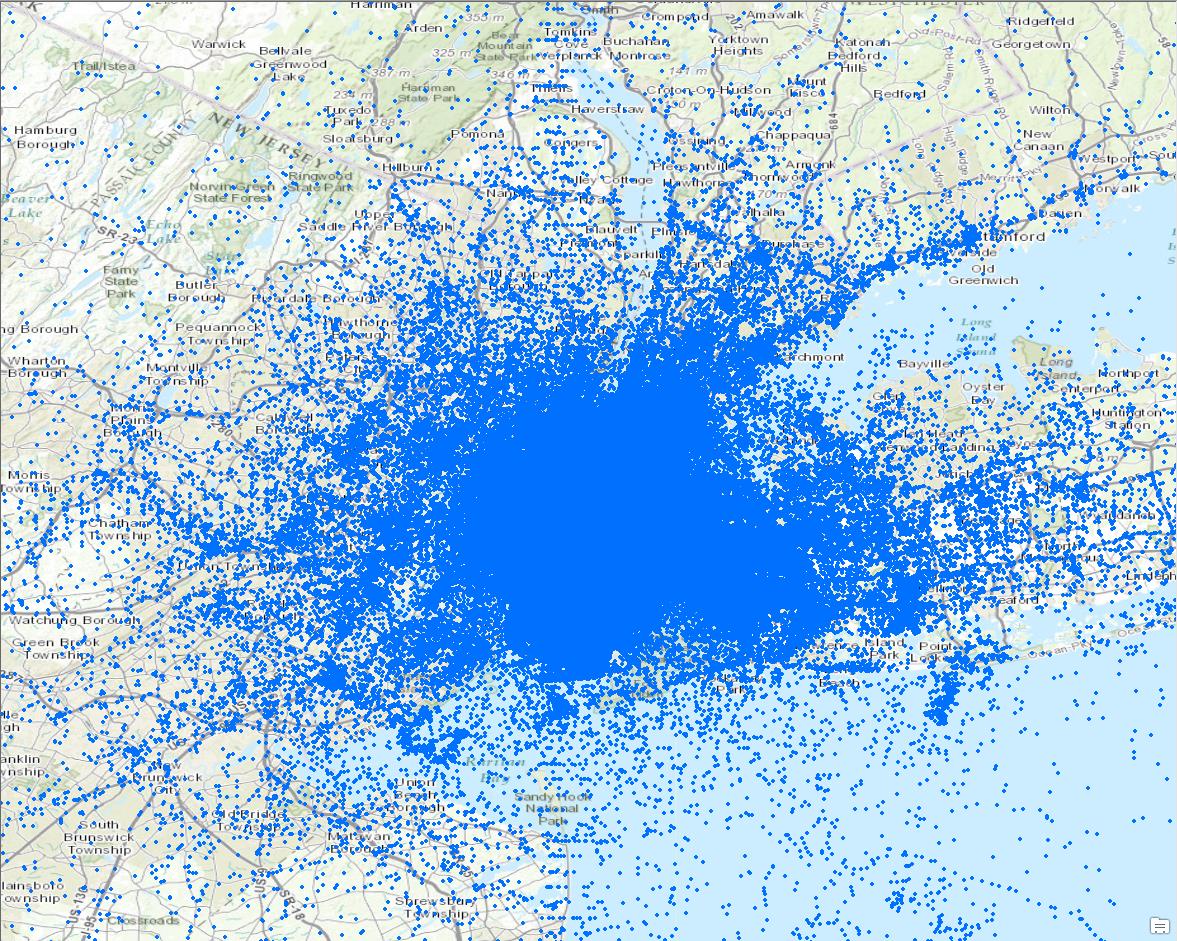
It’s pretty hard to gain any information from this map. You can kind of see that most points are close to NYC, but that’s about it. This dataset is actually NYC taxi data that is freely available online. While it’s a very interesting dataset, it can be hard to deal with such mass quantities of data.
To see underlying patterns you can aggregate these data into spatial bins. By just looking at the count of points in a bin, we begin to see patterns emerge, and figure out interesting questions to ask from our data. Here is what the aggregated data looks like:
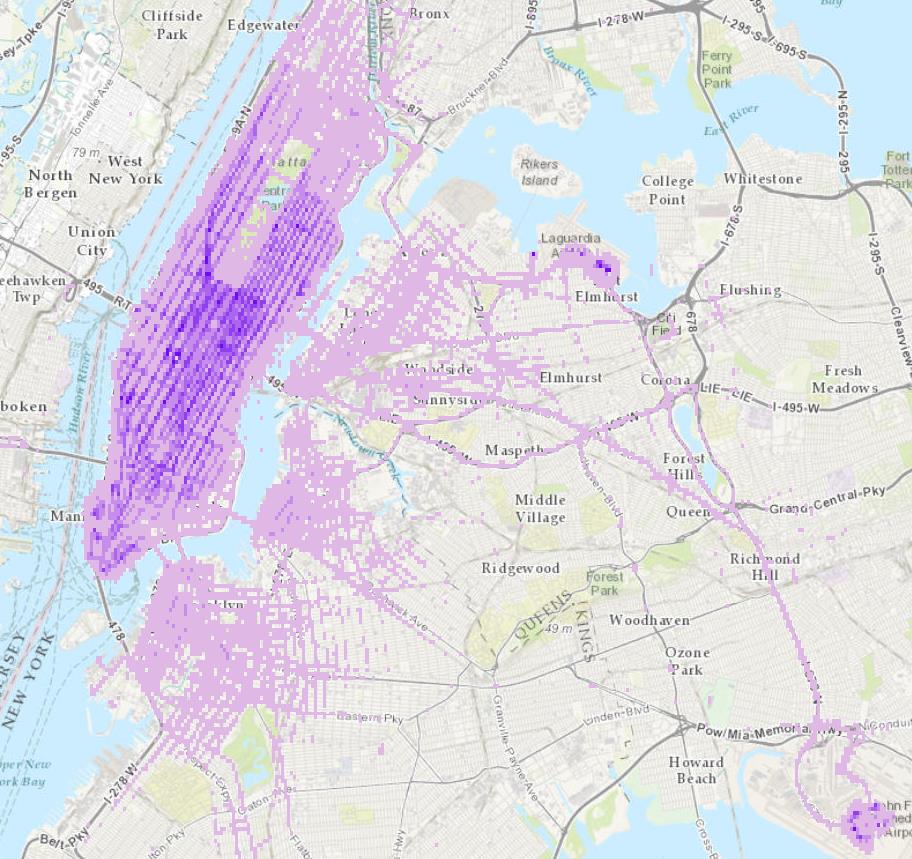
The darker areas represent higher counts of taxi drop-offs (particularly in Manhattan, and both airports). Spatial aggregation allows us to summarize the dataset, make it more visually appealing, informative, and allows us to begin asking more questions.
This spatial analysis ability is available using the GIS Tools for Hadoop. There is a new tutorial posted that takes you through the steps of aggregating taxi data. You can find the tutorial here.
Happy Data Mining!
(Post submitted by Sarah Ambrose, Big Data Team)

Article Discussion: