Elevation data supports numerous GIS applications ranging from deriving slope and aspect, stream delineation, cut and fill analysis, viewshed analysis, orthorectification of aerial photography or satellite imagery, rendering 3D visualizations, creating relief maps, and for various types of analysis and visualizations.
Esri makes it easy to work with elevation data by offering two dynamic world elevation image services (Terrain and TopoBathy). These services provide online access to a global collection of multi-resolution and multisource elevation data. This collection includes best publicly available data and community data with resolutions ranging from 1000 meters to 3 meters. The services provide a single endpoint for desktop and web applications to access elevation values and derived products. The great thing about these services is that you no longer have to store, compile, and process terabytes of elevation data on your local machine. All of the pre and post processing that goes along with these types of datasets has been taken care of for you.
The elevation services are available for use within the ArcGIS Online platform, and are part of the Living Atlas. You can access the entire collection of layers along with geo-processing tools from within the Elevation Layers Group on ArcGIS Online. Access to these global layers is free and does not consume any credits; all you need is an ArcGIS Organizational account. It’s that easy!
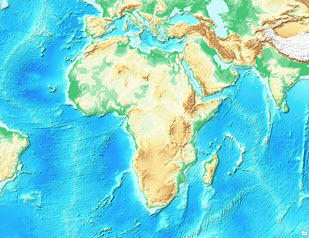
Below is a visual representation of the elevation layers available within the Elevation Layers Group.
 Figure 1: Elevation layers available on ArcGIS online
Here’s how it works: We’ve built two dynamic world elevation image services named Terrain and TopoBathy. These services provide you access to the raw elevation data. In addition to the raw data, we’ve compiled a carefully selected set of derivative layers (like hillshade, slope and tinted hillshade – see figure 1). The derivative layers have been built by adding a server function on top of the Terrain and TopoBathy services.
To learn more about how to use the raster functions via ArcGIS Online and Desktop, see the following:
- Using World Elevation services in ArcGIS Online
- Using World Elevation services in ArcGIS for Desktop
- Using image services in analysis and geoprocessing
To help you choose which elevation layer to use, we’ve put together a simple table that will fast track your decision making process. The table also provides a direct link to each of the layers within the Elevation Layers Group.
| Name | Description | For visualization | For analysis |
| Terrain | This dynamic image service provides numeric values representing ground surface heights, based on a digital terrain model (DTM). The ground heights are based on multiple sources. Heights are orthometric (sea level = 0), and water bodies that are above sea level have approximated nominal water heights.. This is the base service which has various server functions defined. | No | Yes |
| TopoBathy | This dynamic image service combines topography (land elevation) and bathymetry (water depths) around the world. Heights are based on multiple sources and are orthometric (sea level = 0, and bathymetric values are negative downward from sea level). The source data of land elevation in this service is same as in the Terrain layer. This is the base service which has various server functions defined. | No | Yes |
| Hillshade | Provides a hillshaded surface generated dynamically using the hillshade server-side function on the Terrain layer with a solar azimuth of 315 degrees and solar altitude of 45 degrees. | Yes | No |
| Multi-Directional Hillshade | Provides a hillshaded surface generated dynamically using a multi-directional hillshade server-side custom function on the Terrain layer. | Yes | No |
| Elevation Tinted Hillshade | Provides an elevation tinted hillshade surface generated dynamically using a chain of server-side functions on a Terrain layer. | Yes | No |
| Ellipsoidal Height | Provides ellipsoidal heights calculated dynamically using a server-side function to add the EGM2008 geoid model to orthometric heights from the Terrain layer. This can be used for orthorectification. | No | Yes |
| Aspect Map | Provides a colorized representation of aspect, generated dynamically using the server-side aspect function on the Terrain layer. | Yes | No |
| Aspect | Provides aspect values calculated dynamically using the server-side aspect function applied to a Terrain layer. The values are float, and represent the orientation of the downward sloping terrain in degrees (0 to 359.9), clockwise from north. Cells in the input raster that are flat with zero slope are assigned an aspect of -1. | No | Yes |
| Slope Map | Provides a colorized representation of slope, generated dynamically using a server-side slope function on the Terrain layer followed by the application of a colormap. | Yes | No |
| Slope in Degrees | Provides slope values calculated dynamically from the elevation data (within the current extents) using the server-side slope function applied to a Terrain layer. The values are integer and represent the angle of the downward sloping terrain (0 to 90 degrees). | No | Yes |
| Slope in Percent | Provides slope values calculated dynamically from the elevation data (within the current extents) using the server-side slope function applied to a Terrain layer. The values represent the angle of downward-sloping terrain, measured from 0 to 1,000 percent. | No | Yes |
Table 1: Provides links,description and use of various elevation layers available on ArcGIS online
Highlights of the ArcGIS Online July release
The World Elevation services are live, and we are continually expanding and improving the resolution of the collection. Below are some of the most recent additions which we rolled out in the July release.
New server function:
We released Esri’s next generation hillshade to further improve our topographical relief representation. The new hillshade sits on-top of the terrain service as a custom raster function. We will share more news about this exciting hillshade in a follow up blog.
Data update:
We updated our USGS NED data, adding Canada and partial areas in Alaska at ~30m resolution (NED 1 arc sec) and are improving coverage of our ~ 3m (NED 1/9 arc sec) resolution in the US.
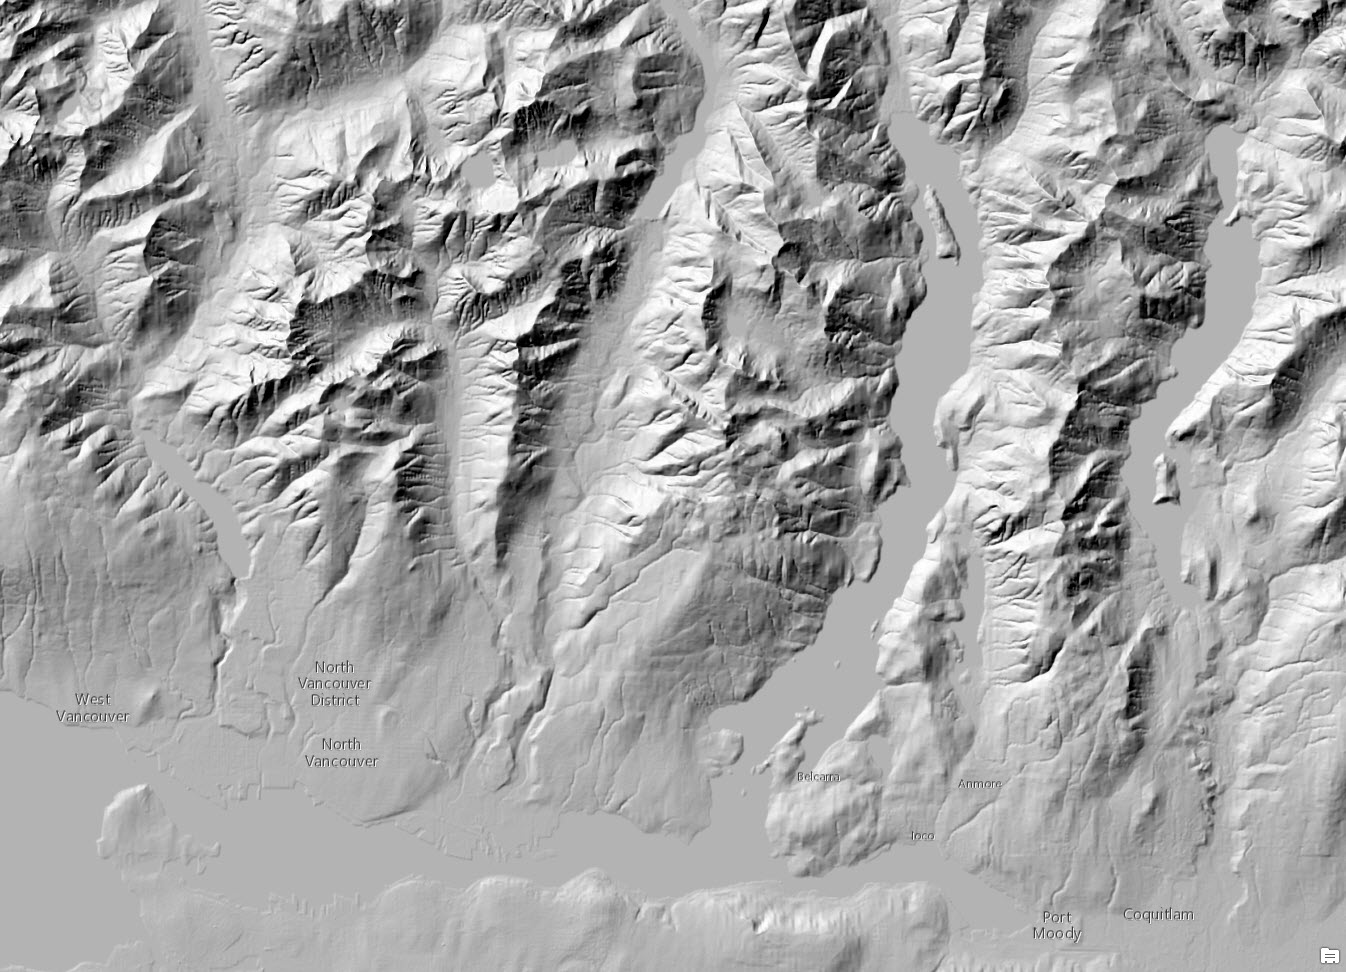
Figure 2: A portion of Vancouver, Canada showing NED 1 arc sec (~ 30 meter) from USGS.
The World Elevation services not only include the best publicly available data, but they are also supported by data from the GIS community. In the July release, we are excited to welcome the following early adopters of the Community Maps for Elevation program:
| Data | Resolution (meters) | Contributor | Primary Source |
| Denmark |
3.2 & 10 |
Esri Denmark | Geodatastyrelsen |
| Finland |
3 &10 |
Esri Finland | NLS |
| UK |
50 |
Esri UK | Ordnance Survey |
| FEMA |
3 |
FEMA | FEMA |
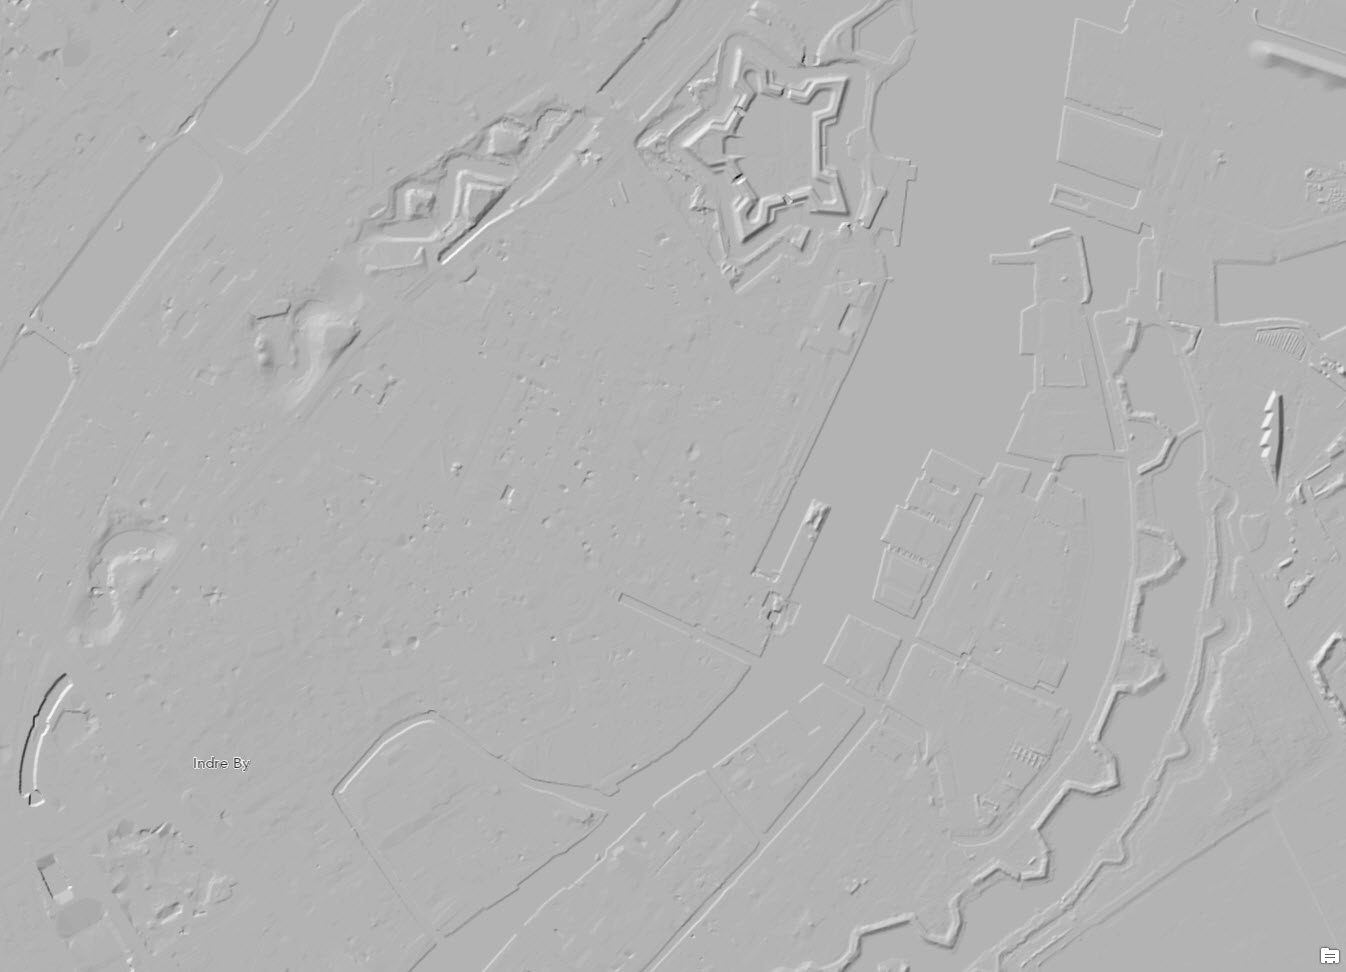
Figure 3: LiDAR derived terrain (~ 3 meter) representation of Copenhagen, Denmark.
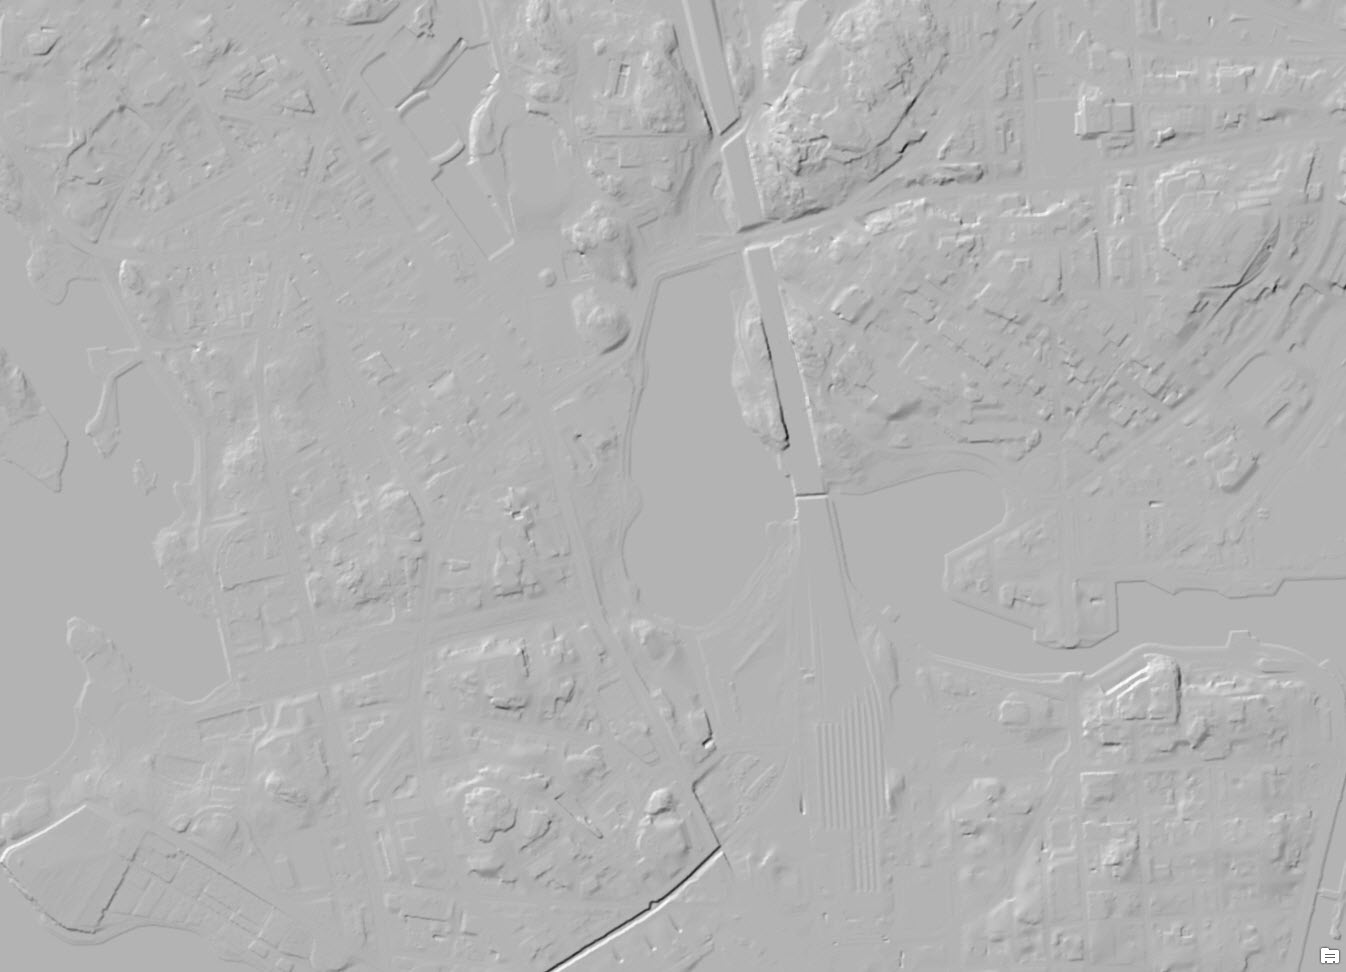
Figure 4: LiDAR derived terrain (~ 3 meter) representation of Espoo, Finland.
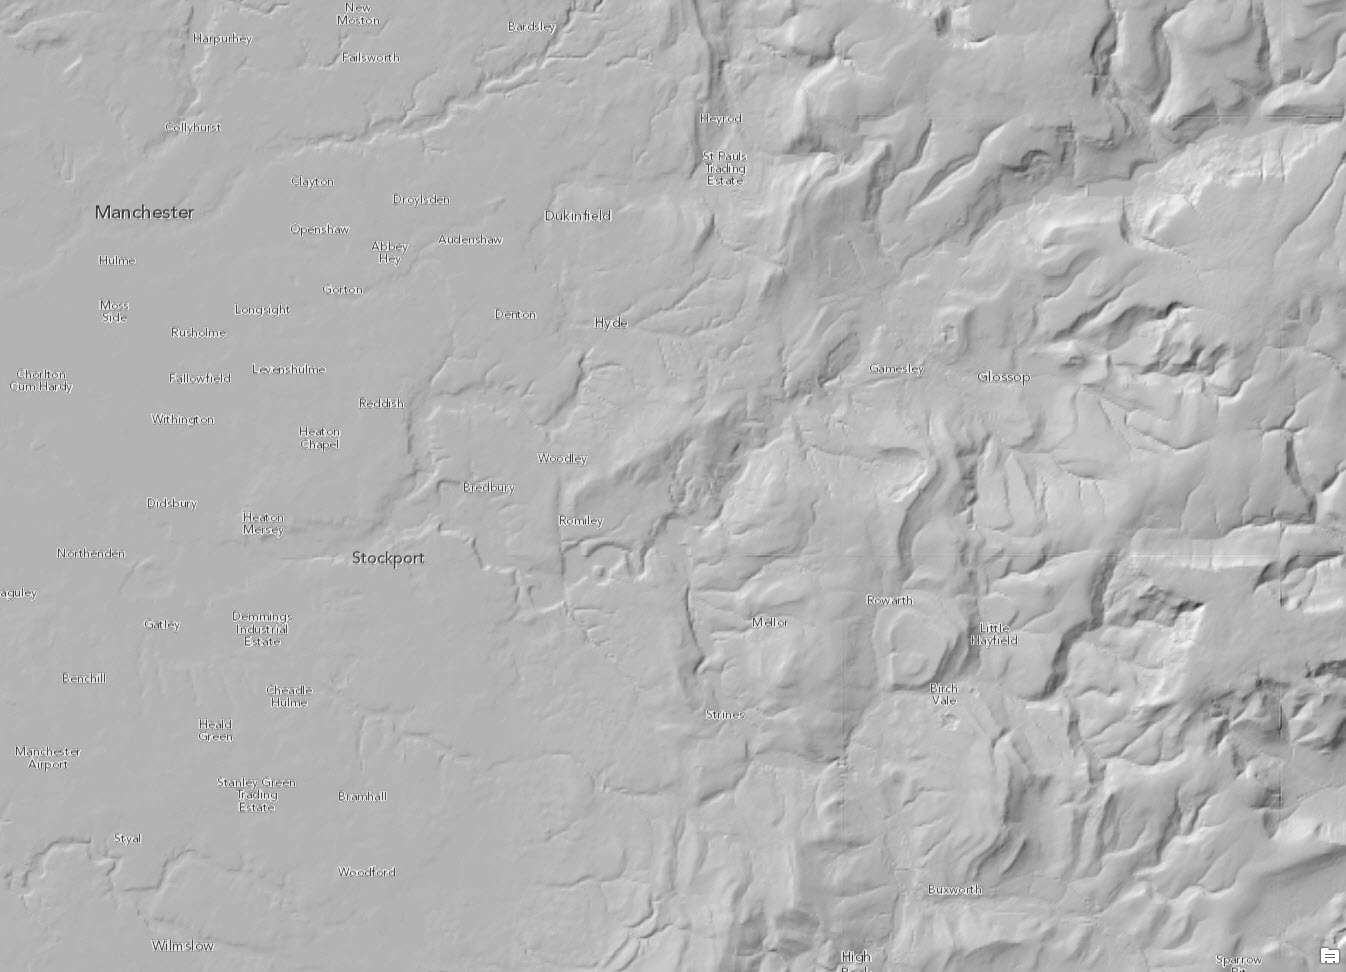
Figure 5: Manchester, UK depicted by OS Terrain 50.
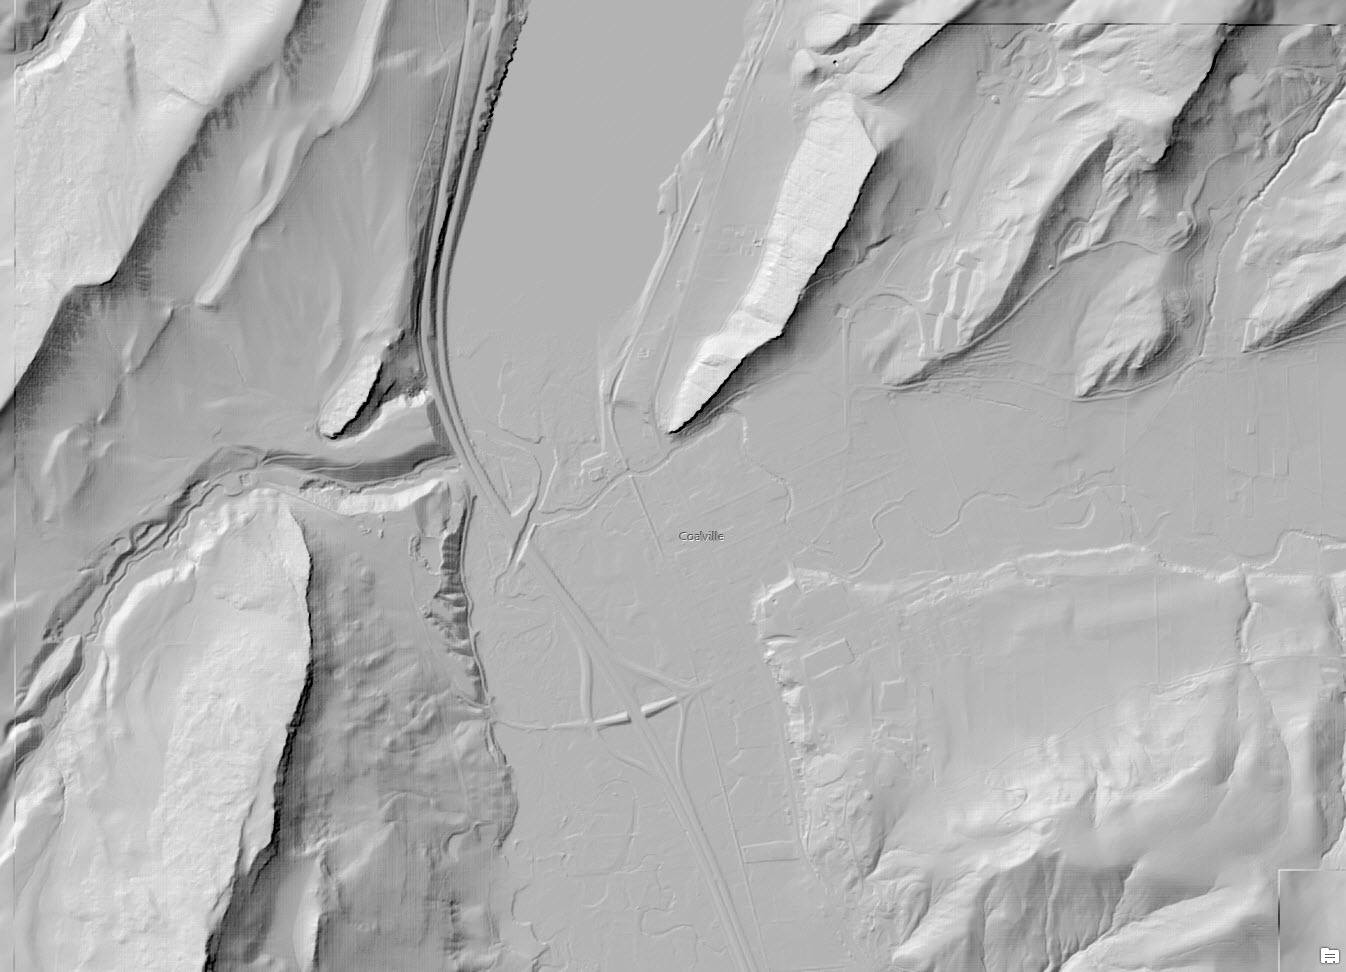
Figure 6: LiDAR derived terrain (~ 3 meter) representation of Coalville, Utah, USA from FEMA.
For more information about the coverage of the World Elevation services please check out our Elevation coverage map. This shows the extents of the various datasets that make up the World Elevation services – Terrain and TopoBathy. The Elevation coverage map is a layer in the ArcGIS platform for discovering resolution, extent and primary sources of data in the world elevation services.
Esri elevation services provide you with one-click access to terabytes of elevation data. They provide a baseline for analysis and visualization which supports many common GIS elevation tasks. Keep an eye out for additional data updates via the ArcGIS user community as we continue to improve the resolution, coverage, and quality of data available. For more information on becoming a Community Maps for Elevation contributor, click here.
by Rajinder Nagi, Esri Product Engineer


Article Discussion: