 In March we rolled out quite a few updates to Esri products and the Operations Dashboard for ArcGIS was no exception. A lot of exciting new features were added and you can find a full list of updates on our doc site or a preview of them from this blog article.
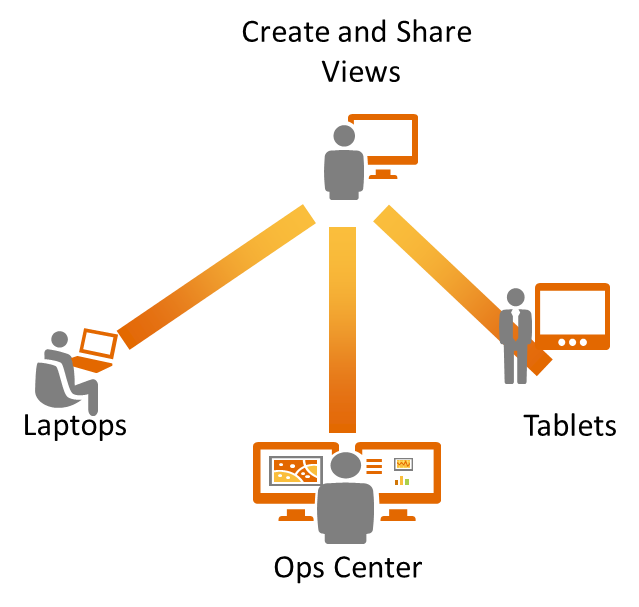
Perhaps the most sought after request that we added this release is to extend the reach of Dashboard beyond Windows Desktops and laptops and add support for tablets (iPads and Android tablets) so that more people within the organization can use it. With the 10.2.2 release, we have done just that by building Dashboard into the browser so it can run across platforms.
This blog article will describe how you can author operation views that target the browser and highlight capabilities within the browser app itself.
Authoring an Operation View for the browser Dashboard in a web browser
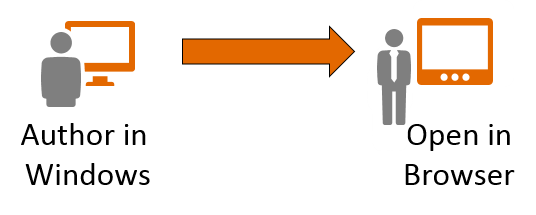
The Dashboard browser app targets the consumer of an operation view. The Windows app is still required – it is the publisher of an operation view but now you can use either the Windows app or your web browser to open and use an Operation View.
First, only single display Operation Views are supported in the browser. The single display operation view type defines the user experience for the browser. It makes it simple and easy to understand.
 If you have existing operation views you can save it as a single display operation or create a new one from scratch but you will need to use the Windows app to do it. The Save As and New dialogs include the ability for you to set the Operation View type. So if you have an existing view that is a multi display view, you can save a copy of it to a single display view and then use it in the browser.
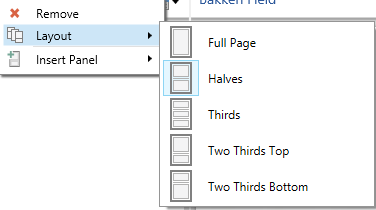
 Single display operation views organize widgets into a series of panels that you can either swipe through or display side by side. They are docked together and alongside of your map widget. Each panel has a set of layout options that you can choose from to build your operation view.
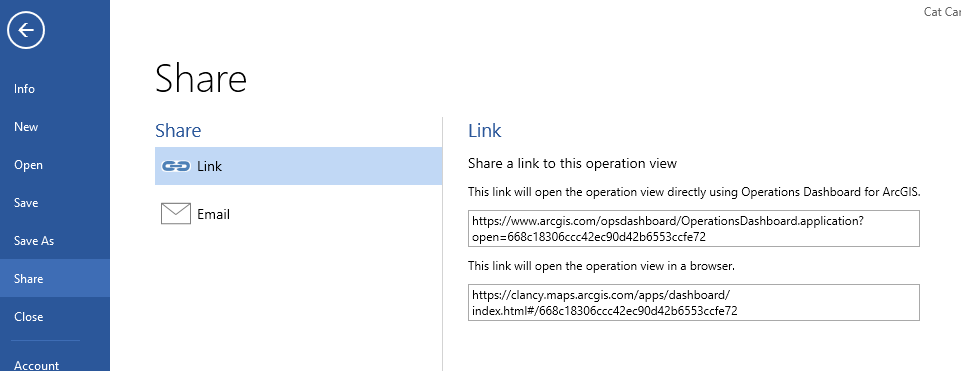
 Once you have authored a single display operation view you can share it inside of your ArcGIS organization via groups so that others have access to open and use it. Within the Windows Dashboard you can also share a link directly and embed it in a web page or send it by email.
Using Operations Dashboard in a browser
Tapping on the link either from within your ArcGIS organization or from an email will open the operation view in your browser. If you are using a Windows desktop or tablet and you click on the item from within your organization’s web site it will ask you if you want to open it in either the Windows app or the Browser app. Quite often you will be opening the link on your iPad though and here the Dashboard will immediately open in a browser. If not already signed in to your organization it will ask you to do that first as Dashboard requires you have a named user to use it.
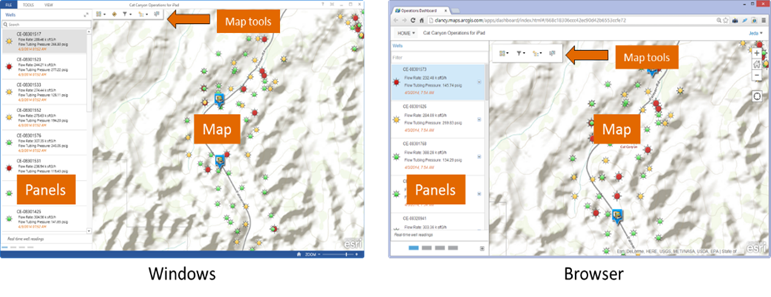
You will find that the look and feel of Operations Dashboard in a browser is very familiar to using Windows. Panels are located in the same place, you can tap through each of the panels or expand to see multiple, the map is to the right and the map tools are located in the top left of the map widget.
 There are some differences between the two due to the nature of running in a web browser and design for touch screen tablets. Here is an example of where you right click to access feature actions in a list when in Windows but you will tap a button to access feature actions in the browser.

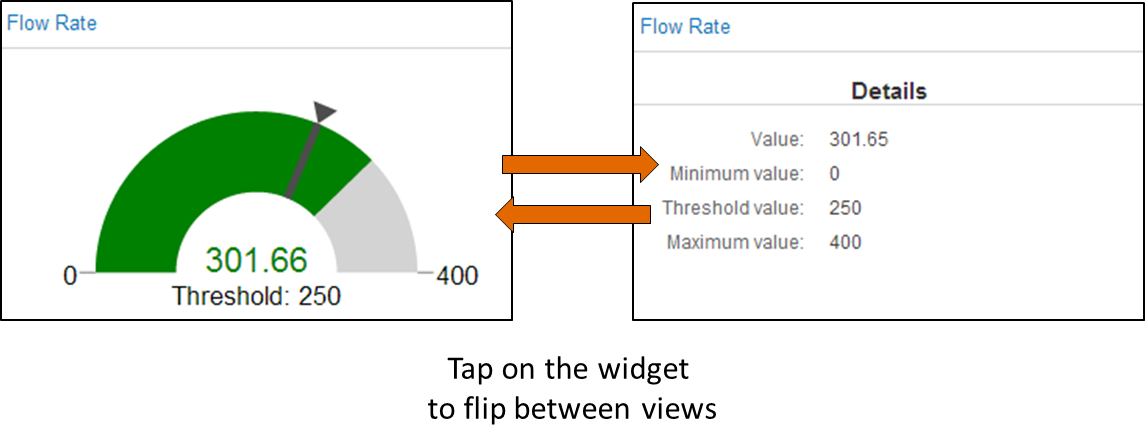
One of the optimizations made in the Browser app comes when looking at graphical widgets like the Gauge widget. Here you can view the gauge just as you can within the Windows app but you can also tap on the gauge to view textual details about the information being reported.
Things you should know
There are a few things about the browser app you should know:
- It is a web app that comes with your ArcGIS organization and is hosted inside of ArcGIS Online. With the 10.3 release of ArcGIS Server (planned for this fall) we will include the Browser app as part of Portal for ArcGIS. It is not available for Portal customers now.
- Not all of the widgets available in the Windows version are in the Browser version. We are working to reach parity between the platforms with a set of focused releases between now and July. You can see a full list of differences here as well as a sneak peak of what we are planning for the Dashboard in future releases.
- The Browser app is not extensible, yet. Extensions that you write with the ArcGIS Runtime SDK for WPF will not run in a browser and we currently do not have an API that you can use to extend the browser app either. We are planning a new cross platform extensibility model and will blog about it when we have more details to share.
We would love to hear your feedback about the Operations Dashboard and its capabilities. You can post comments to this blog post or you can email us directly at Dashboard4ArcGIS@esri.com.
Apps Team


Commenting is not enabled for this article.