If you’re working with huge mosaic datasets, with hundreds or even thousands of rasters, then this blog is for you. I’m hoping we can clarify some questions that have come up with regards to how display ordering occurs with mosaic datasets. For you visual learners out there, enjoy the following flow chart. And for those of you who like to learn verbally, enjoy the rest of this blog.
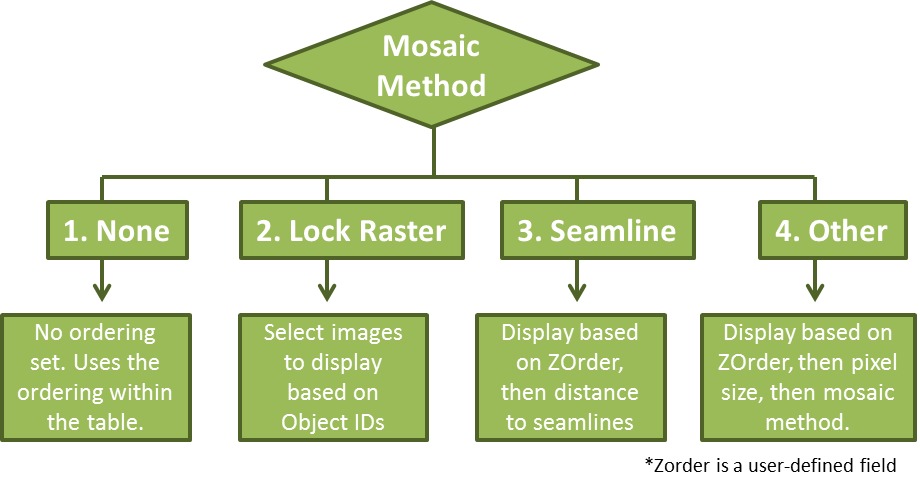
Option 1: “Quick and easy, no thinking required.”
The first option that you have is None. None is suitable when you’re cataloging your imagery collection, and it’s not important which layers are displayed on top.
Option 2: “I know which images I want to look at, forget the rest.”
The second option is LockRaster. Choose this option when you know the specific raster IDs that you want to show. Populate the list, and only those rasters will display.
Intermission: “ZOrder? SOrder? Are these action heroes from a planet not in this solar system?”
So far, so good. Right? Well now there’s a couple of concepts that you need to wrap your head around. One is ZOrder, the other is SOrder. Both of these are columns in the table that rank the order in which the items will display. Talking about ordering can get confusing, so it’s easiest if you imagine all of your overlapping images as part of an image stack. The image on top of the stack is what is visible, those at the bottom would be the last to display.
ZOrder gives you total control over the ordering of items in your image stack. You can edit this field in the table to change the ordering of items in your image stack. Items with the lowest value in the ZOrder column will be at the top of your image stack (displaying first) and the highest values will be at the bottom of your stack (displaying last). With any of the following options, ZOrder is the principal deciding factor, and the other methods only come into play if the ZOrder is equal. In ZOrder, 0 functions as a <Null> and will display before any items with positive values. If you want to change the ordering, we suggest using negative values to push a specific image to the top of the list. All items are listed as <Null> by default in ZOrder, so if you want to don’t want to wade into this, you don’t have to. To reiterate: it’s here if you want total control over the display order.
SOrder is populated after you generate seamlines, and ranks items based on the distance to those seamlines. You cannot edit this column. The only difference between SOrder and ZOrder in that 0, or <Null>, will be at the bottom of your image stack.
Option 3: “I want my imagery to look as smooth as possible.”
The third option, Closest to Seamlines, works only if you have generated seamlines and only as a tie breaker for ZOrder. This is a good practice if you want to mitigate artifacts that are created from the boundaries of neighboring or overlapping rasters. Once seamlines are created, the ranking order is populated in the SOrder field, with smaller values taking precedence.
Option 4: “Decision time. Put on your thinking cap!”
This is actually a set of options:
If two images have the same ZOrder value, the tie breaker is based on pixel size. Note that pixel size in a mosaic dataset is based on a tolerance factor. For example, let’s say you have three images with pixels that are 0.95 m, 1 m, and 1.05 m and your tolerance factor is 0.1. If you request a pixel size of 1 m, then they will be read as having the same pixel size. When there is a difference in pixel size they are sorted based on the distance to the requested cell size.
Finally, if two images have the same ZOrder value, and the same pixel size, then the deciding factor is based on one of the following ordering options (which you have to choose before-hand):
– Northwest This static option orders the imagery based on distance to the northwest corner. This is the default option.
– Closest to Center As you navigate through your imagery collection, the images that are shown are the ones that are closest to the center of the screen.
– Closest to Nadir works really well with oblique imagery. It looks at all of the imagery available on your screen and finds the point with the lowest viewing angle. The image order is based on which ones are closest to the point which has the lowest viewing angle.
– Closest to Viewpoint selects the images that are closest to the viewpoint of the sensor.
– By attribute is the most commonly used approach. You can order imagery based on acquisition date, cloud cover, or any other attribute that is stored within the table.


Commenting is not enabled for this article.