By Steve Kopp, Esri
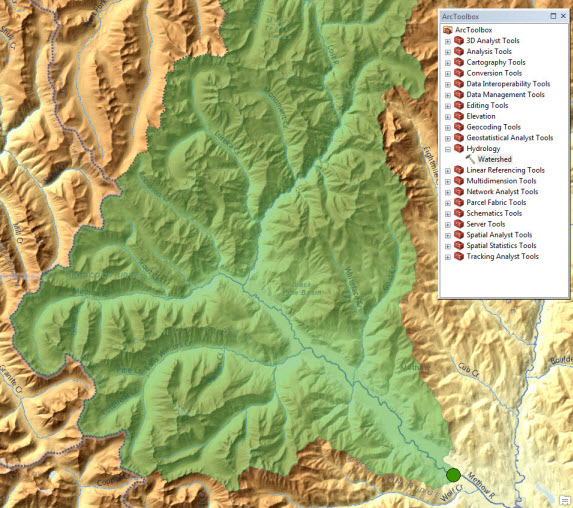
 For the water resources community, one of the highlights at this year’s Users Conference was the public beta release of the watershed delineation service in ArcGIS Online. This geoprocessing service is now available to everyone with an ArcGIS Online for Organizations account. Whether you are interested in floods, droughts, or water quality, you always need to know what’s upstream. Now, just give it a point and get back a watershed in a few seconds, it’s really that simple. No more downloading DEM tiles to run a collection of Spatial Analyst tools and learning the art of hydroconditioning a DEM all to make a single watershed.
This service is part of a new collection of Ready to Use maps and apps available in ArcGIS Online, and is part of a larger landscape project which curated over 60 natural resources data themes and hundreds of variables from authoritative, best-available sources.
The watershed delineation service is currently available for the continental US and is based upon the NHDPlus version 2 data. The tool can be used in ArcGIS Desktop, ArcGIS Explorer or any web client. To use it in Desktop and Explorer you need to first add a connection to ArcGIS Server http://hydro.arcgis.com/arcgis/services. Instructions are found in the watershed delineation service description. For developers, find additional details on the service and how to use it on the developer page for the service.
For a demonstration of the watershed delineation tool in a Javascript application take a look at the WatershedExplorer application (login using your ArcGIS Online organization account credentials).
Please provide feedback to us by emailing CScopel@esri.com or by posting your concerns on the forum.
In the future, we will release toolboxes and templates to help you build your own Geoprocessing services. We’re continuing to work on new tools, and also adding new areas to the service.
Imagine you could click a point on a map anywhere in the world and delineate the drainage basin in seconds. Then overlay this basin with other data and find out how much rainfall, how many people, or how many square kilometers of forest are upstream of that location, all through a simple web interface. This is where we are headed, and it’s not far away.

Article Discussion: