This blog shows you how to calculate and symbolize wind or current speed and direction when the underlying data is stored as U and V vectors. In order to capture the speed and direction of wind or a water current, anemometers or Doppler current profilers measure the velocity of the wind or water in two perpendicular directions, U and V. U is the velocity toward east and V is the velocity toward north. U is sometimes referred to as the zonal velocity and V the meridional velocity. Using U and V, both the speed and direction of the wind or water current can be calculated.
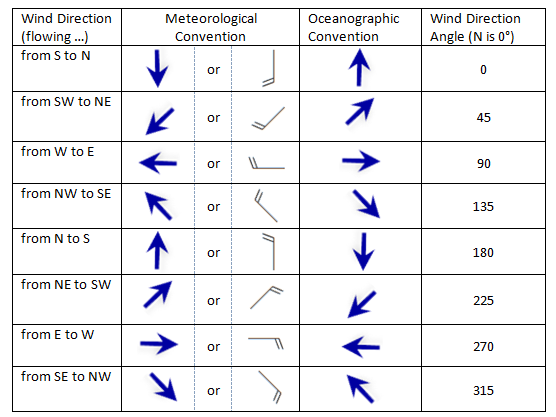
Storing information about the flow of wind or water as vectors provides flexibility in how we calculate direction. This is important because meteorologists and oceanographers describe the flow of wind differently. Oceanographers prefer to describe wind in terms of the “direction of mass flow” or in other words the direction towards which the wind is blowing. In the oceanographic convention, wind flowing from the south to the north is symbolized by an arrow pointing north. Meteorologists use an arrow or a special symbol called a wind barb to show the direction from which the wind is blowing. The head of the arrow or wind barb points in the direction from which the wind is blowing. In the meteorological convention, a wind blowing from west to east is symbolized by an arrow pointing west. Water currents are almost always symbolized using the oceanographic convention.
Displaying Direction
To correctly display wind or current direction in ArcMap, the U and V components must be converted to a symbol rotation angle. The steps below assume that you have a point feature class with the attribute fields u and v. To calculate the rotation, follow the steps below:
- Right-click the point layer in the table of contents.
- Click Properties and click the Symbology tab.
- Click the Symbol. The Symbol Selector dialog box opens.
- Choose an arrow or wind barb whose head is pointing north.
- Click OK to close the Symbol Selector dialog.
- Click Advanced and choose Rotation from the drop-down list. The Rotation dialog box opens.
- Choose <expression> in the drop-down list.
- Click the Expression Builder button to provide the expression to use for rotating the symbol.
- Specify one of the following expression:
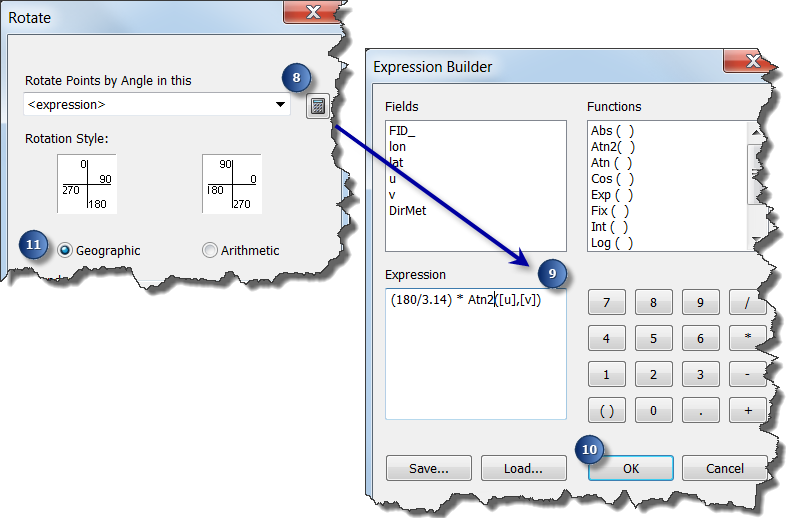
- Oceanographic Convention: (180/3.14) * Atn2([u],[v])
- Meteorological Convention: (180/3.14) * Atn2([u],[v])+180
Note: The formulas above are correct only if U and V are measured relative to a grid where true north consistently points straight up (e.g. no rotation). Otherwise, a convergence angle correction must be applied based on the projection of the data.
- Click OK to close the Expression Builder dialog.
- Click Geographic for the Rotation Style.
- Click OK on all dialog boxes.
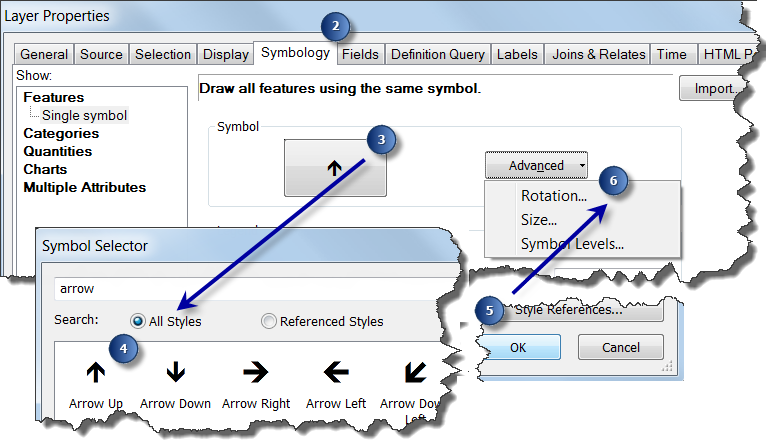
This image shows the Symbology tab and Symbol Selector with the steps marked to apply symbol rotation.
This image shows the Expression Builder dialog with the steps marked to apply symbol rotation.
Displaying Speed
Using a similar procedure, U and V components can be used to calculate and display wind or current speed in ArcMap.
- Right-click the point layer in the table of contents.
- Click Properties and click the Symbology tab.
- Click Advanced and choose Size from the drop-down list. The Size dialog box opens.
- Choose <expression> in the drop-down list.
- Click the Expression Builder button to provide the expression to use for the size of the symbols.
- Specify the following for the expression: Sqr([u]**2 + [v]**2)Tip: ArcMap assumes that the size of the symbol returned from the expression is in points (1/72 of an inch). If the wind or current speeds are relatively low in your data, the symbols may be too small and cartographically unpleasing. You can adjust the size of the symbols by including a scaling factor in the formula. For example, Sqr([u]**2 + [v]**2) * 10 will increase the size of the symbols by a factor of 10.
- Click OK to close the Expression Builder dialog.
- Click OK on all dialog boxes.


Article Discussion: