Contours are lines that connect locations of equal value in a raster dataset. They are useful because they can show the shape of the phenomena represented by the raster surface that may be otherwise difficult to see.
In addition to raster and contour line representations of surfaces, visualizing and symbolizing surfaces as contour polygons (Fig. 1) can provide useful capabilities. For example, querying the particular polygon can give you the area of elevation values between 100 m and 200 m, or allow you to select the polygon that represents the perimeter of a water body, or summarize all the vegetation types within each contour range.
A script tool is available for ArcGIS 10 that allows you to create these filled contour polygons, and is downloadable from the Analysis and Geoprocessing Tool Gallery.
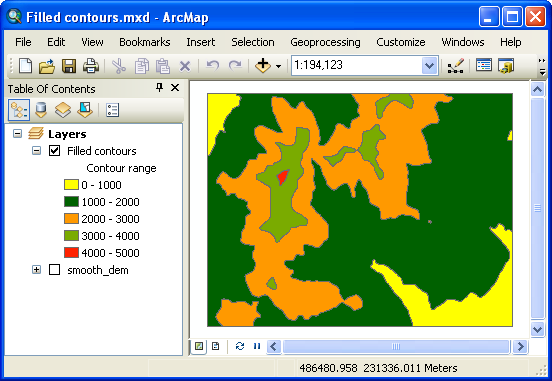
Figure 1: Filled contours displayed in ArcMap
Commenting is not enabled for this article.