by Rafael Fernandes
 The City of Redlands must lower its water consumption by 20% by the year 2020 or risk losing state water grants. To tackle this problem, Redlands wants a better understanding of how residential water is currently being consumed. Income, population density, and vegetation were explored as possible indicators of water consumption.
Required layers: Imagery and census data
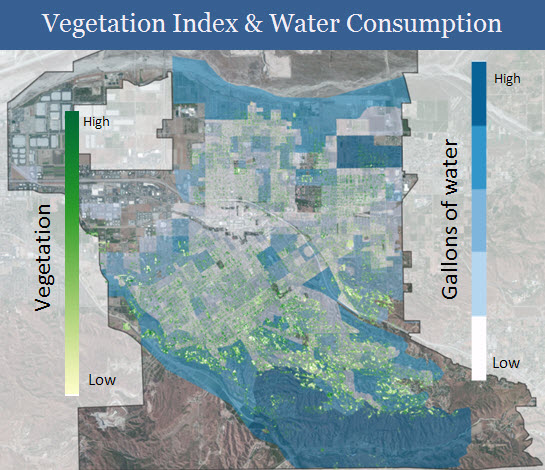
The imagery was used to create a vegetation index, which defined a range of high to low vegetation. Census data was used to collect income and population density information.
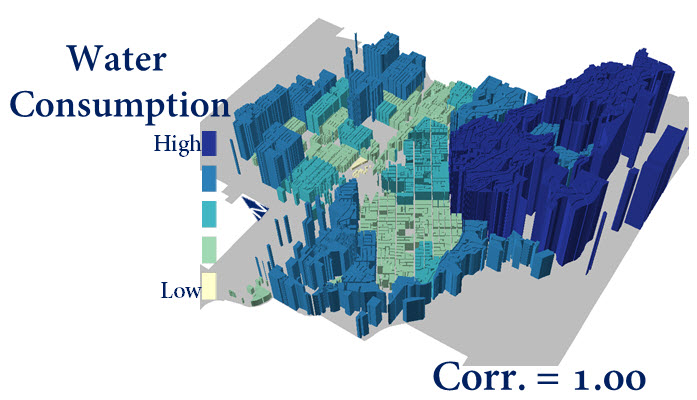
Once all of the data were processed, a correlation analysis was used to identify which of these three factors was the best indicator for water consumption.
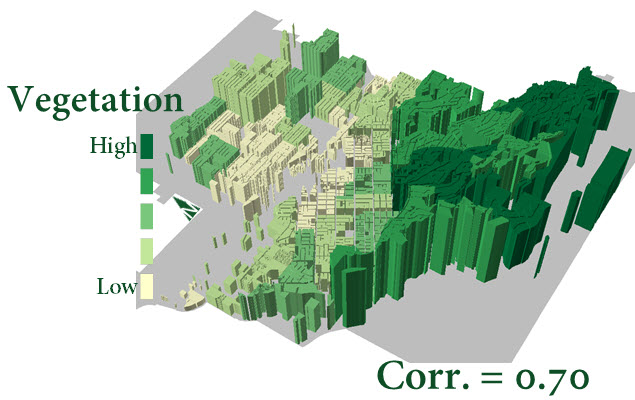
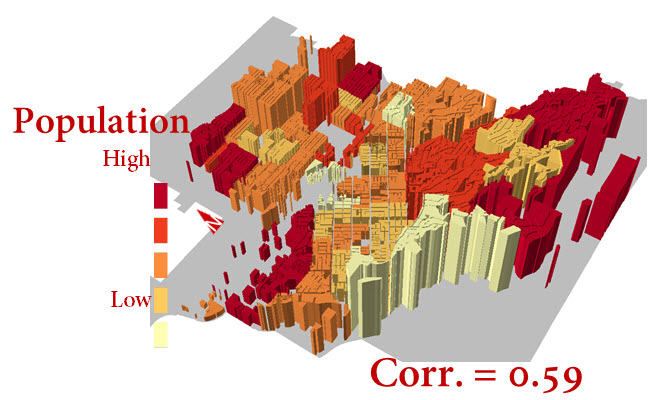
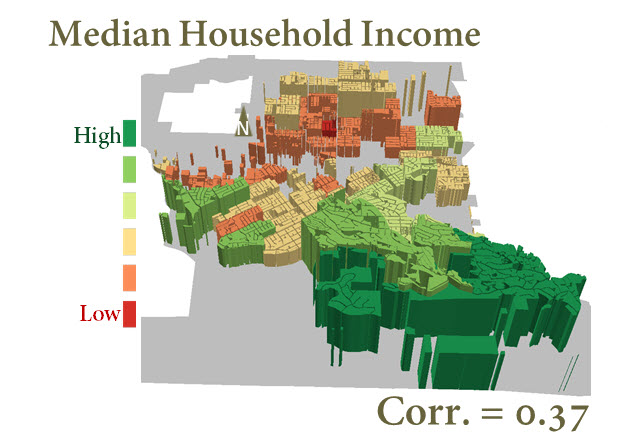
Population density and household income were good indicators of water consumption , however, vegetation was a significantly better indicator. The vegetation may be a good indicator because Redlands is a part of the chaparral eco-region, which is known for dry climate.
With this information, Redlands can now target areas with the highest vegetation and highest water consumption to help lower their total consumption.
To see this study, or if you’d like more information, please contact Rafael Fernandes (RafaelFernandes103@gmail.com).

Article Discussion: