 In Part 1 of this blog entry we showed you how to use the Feature Outline Masks tool to convert annotation feature classes to polygon feature classes in ArcMap which can then be added to your ArcGIS.com web map as an operational overlay. This is a great way of adding labels to your web map (figure 1).
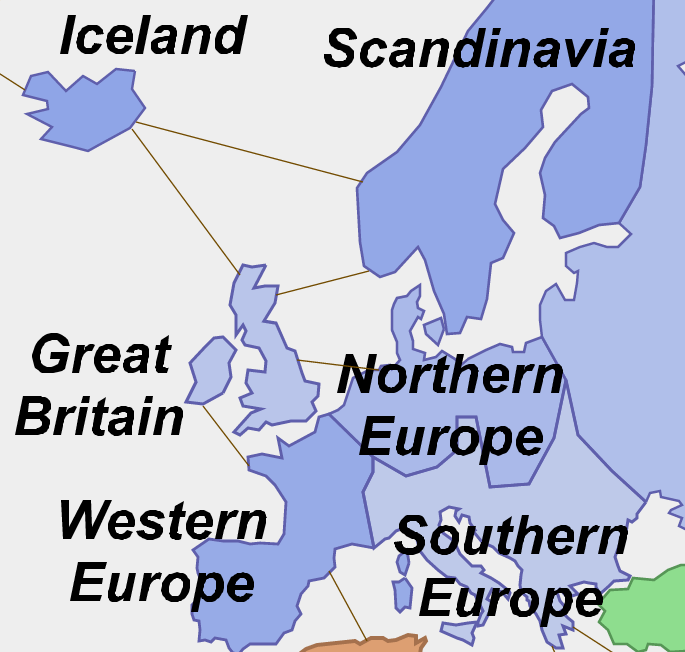
Figure 1. Labeling an ArcGIS.com web map.
To review, the basic approach to creating labels for your web map is:
- design labels for your map layers in ArcMap;
- convert labels to annotation;
- use the Feature Outline Masks tool to create polygon feature geometry from annotation;
- export your polygon feature class to a shapefile format; and
- add the shapefile to your ArcGIS.com web map as an operational overlay.
In the second part of this blog entry, we show you how the same approach can be used to create halos for your labels and how to add font-based graphical components to your web map. These techniques can be used to modify the look and feel of your web map as well as provide useful additional information as operational overlays.
1. Creating halos for labels
Suppose you want to create halos for your web map labels. First, start with your annotation feature class in ArcMap. You then use the Feature Outline Masks tool (in System Toolboxes > Cartography Tools > Masking Tools), selecting your annotation feature class as your input layer. When you used this tool to create the original labels you specified a Margin of zero and set the Mask Kind to EXACT. Since you now want to create a halo, you set the Margin to greater than zero (in map units) so that feature outlines will be created as buffered polygons around the annotation. For the labels in figure 1 a margin of 50km was used and the Mask Kind set to EXACT (figure 2). The resulting polygon feature class can then be exported to a shapefile and added to your web map in ArcGIS.com in the same way as the original labels. The effect you see in figure 2 was achieved by placing the halo shapefile underneath the labels shapefile in the web map layers and applying 50% transparency.
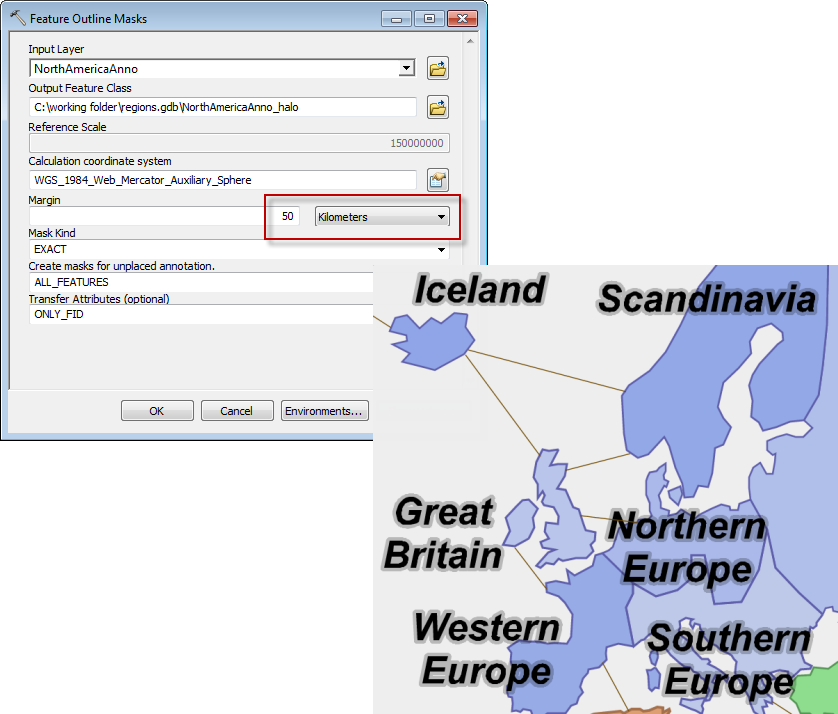
Figure 2. Using the Feature Outline Masks tool to create a halo effect for web map labels.
2. Adding graphics to your web map
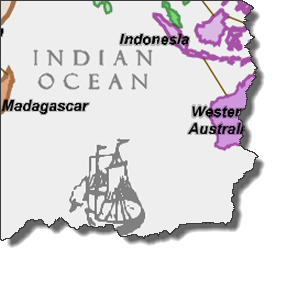
The same approach for adding labels (or halos) to your web map can also be used for adding any font-based graphics. The map of RISK used in part 1 of the blog entry to show you how to add labels has a historic look and feel and contains a number of map adornments such as historic ships (figure 3).
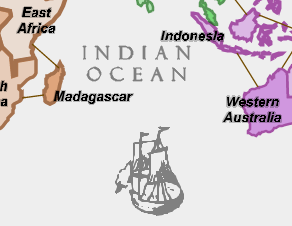
Figure 3. Map adornments on the RISK web map.
To add these graphics to the web map, first you need a true type font that contains the graphics you want to use. For the RISK map, the Esri Historical style gave a great range of different ships and compass rose fonts to select from. You can download the style from Mapping Centerand install the fonts on your system. Once you’ve installed the fonts you want to use, open your Map Document in ArcMap, and add the Draw toolbar (Customize > Toolbars). Select the font (Esri Historical Ships 1) and then use the Text tool to add text directly to the data view of your map (figure 4).
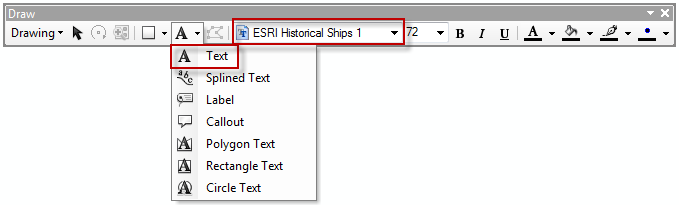
Figure 4. using the Draw toolbar to add text to your data view.
Different font characters will give you different graphics so a useful way to find the graphics you want is via your system’s Character Map (All Programs > Accessories > System Tools). Once you’ve added font-based graphics to your data view you can click on them to select and then re-position, and double-click to open the Properties dialog to modify the size or change other properties (figure 5).
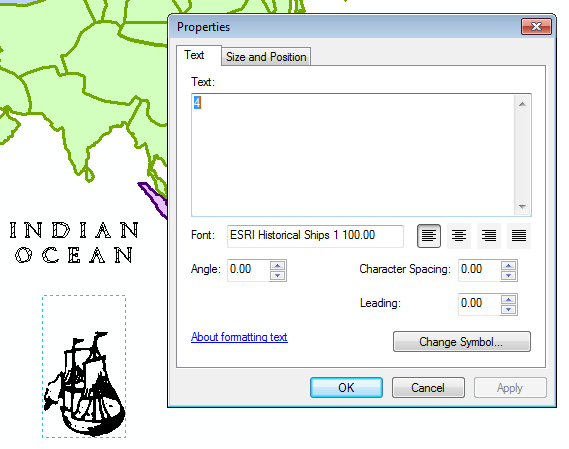
Figure 5. Modifying the properties of a font-based symbol.
Once you are happy with the size and position of your font-based graphics, select them in the data view using the mouse (holding down shift and clicking will allow you to select multiple graphics) and then select the Convert Graphics to Features option from the Draw toolbar menu (figure 6).
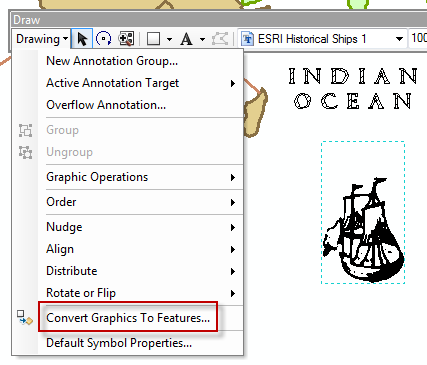
Figure 6. Convert Graphics to Features.
In the Convert Graphics to Features dialog box, specify a suitable output geodatabase for the new annotation feature class and click OK (figure 7).
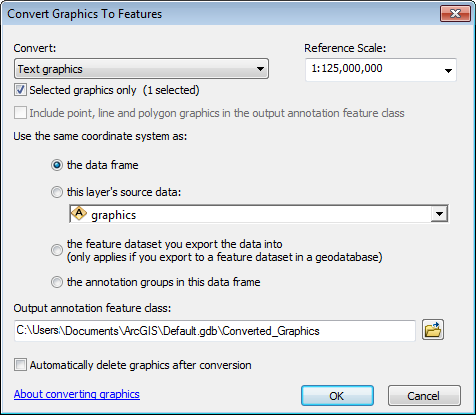
Figure 7. Converting font-based graphics to an annotation feature class.
Your font-based graphics will now be converted to an annotation feature class and added to your Table of Contents. You can optionally check the ‘Automatically delete graphics after conversion’ if you no longer need the original graphics in your data view.
You can now run the Feature Outline Masks tool on the annotation feature class in the same way as you created the labels (in part 1 of this blog entry), specifying a Margin of zero and a Mask Kind set to EXACT. Finally, export the polygon feature class to a shapefile and then add to your web map in ArcGIS.com. Your graphics can now be symbolized in the same way as any other geographic feature. You can modify the fill colour, outline colour and transparency to create different effects.
So let’s take a final look at the RISK web map (figure 8) and see the final compilation of map components with the historic ships being symbolized with no outline and in a light grey colour.
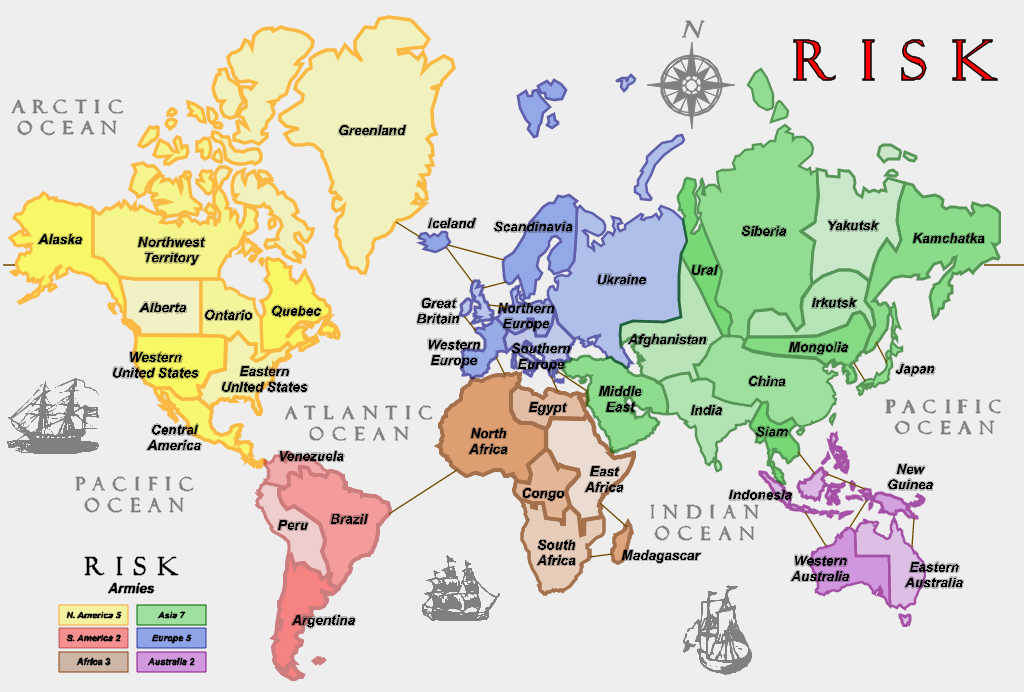
Figure 8. RISK web map.
Part 1 of this blog entry explained how to add the labels for geographic features on your map. In this blog entry you learnt how to add halos to the labels which are used on the map to add visual interest and to modify the visual hierarchy of the map components. The historic ships were added using a modification of the technique by first adding text to the data view in ArcMap, then Converting Graphics to Features before using the Feature Outline Masks tool.
Other than the territory basemap and territory labels, all additional map components were added to the data view in ArcGIS for Desktop using Draw tools and converted to features. By modifying the fonts and sizes you can create titles, textual elements for a graphical legend, additional labels and graphics. The compass rose was added as a font-based graphic using the Esri Historical style North Arrow font in the same way. The remaining textual components such as the RISK title, the ocean labels and the legend text were created by first adding text to the data view in ArcMap then following the same technique to Convert Graphics to Features and so on. The coloured legend boxes were added as graphics to the data view in ArcMap using the Draw tools, before being converted to (polygon) features and then a shapefile.
Finally, you’ll notice that there appears to be no basemap service. This isn’t strictly true. The basemap service has had 100% transparency applied so it disappears, leaving the continuous polygons of the RISK map to act as its own basemap. This demonstrates how you can publish any continuous polygon features and use them as your own basemap and add your own labels and other graphics as operational overlays to give your web map meaning. This is a great way of using ArcGIS.com to publish a map of entirely your own design and extends the ways in which you can author, organize and publish web maps.
The final Cartography of RISK web map can be viewed on ArcGIS.com as a web application.

Commenting is not enabled for this article.