By Dr. A Jon Kimerling, Professor Emeritus, Oregon State University
![]()
If you’ve used any raster DEM data to make maps you may have at one time or another asked yourself, “What is the appropriate map scale for the DEM I am using to make the map?” This question is tied closely to a basic principle of map compilation that you may have learned in your beginning cartography course: “Always compile your map from source materials of the same or larger map scales”. In our age of digital elevation models and other raster datasets, this basic principle of map compilation can be restated as: “Always create your raster map from data at the same or higher spatial resolution than the ground resolution of your map display grid cells”. The ground resolution of your map display grid cells will depend on the scale of your map. An equation you can use that relates map scale expressed as a representative fraction (1/x), DEM cell resolution, and map display resolution is:
1/x = 1 / (DEM cell ground size [cm/cell] × map pixel density [pixels/cm]), so that 1 centimeter on the map represents x centimeters on the ground.
To help you, we’ve summarized this information for some of the most widlely used DEMs in a table that you can download as a PDF from Mapping Center’s ArcGIS Resources – More page. A graphic of it is shown below.
Columns 5-10 in the following table give you basic information about a number of widely available DEMs –- their name, geographic extent, date of publication, source, and in most cases a website where you can learn more about the data and how to download all or part of the DEM. The second column in the table gives the spatial resolution of the DEM in degrees, minutes, and seconds. All but the last DEM have quadrilateral grid cells with the same latitude and longitude extent. The ETOPO5 DEM, for example, is comprised of cells 5 min. by 5 min. in geographic extent.
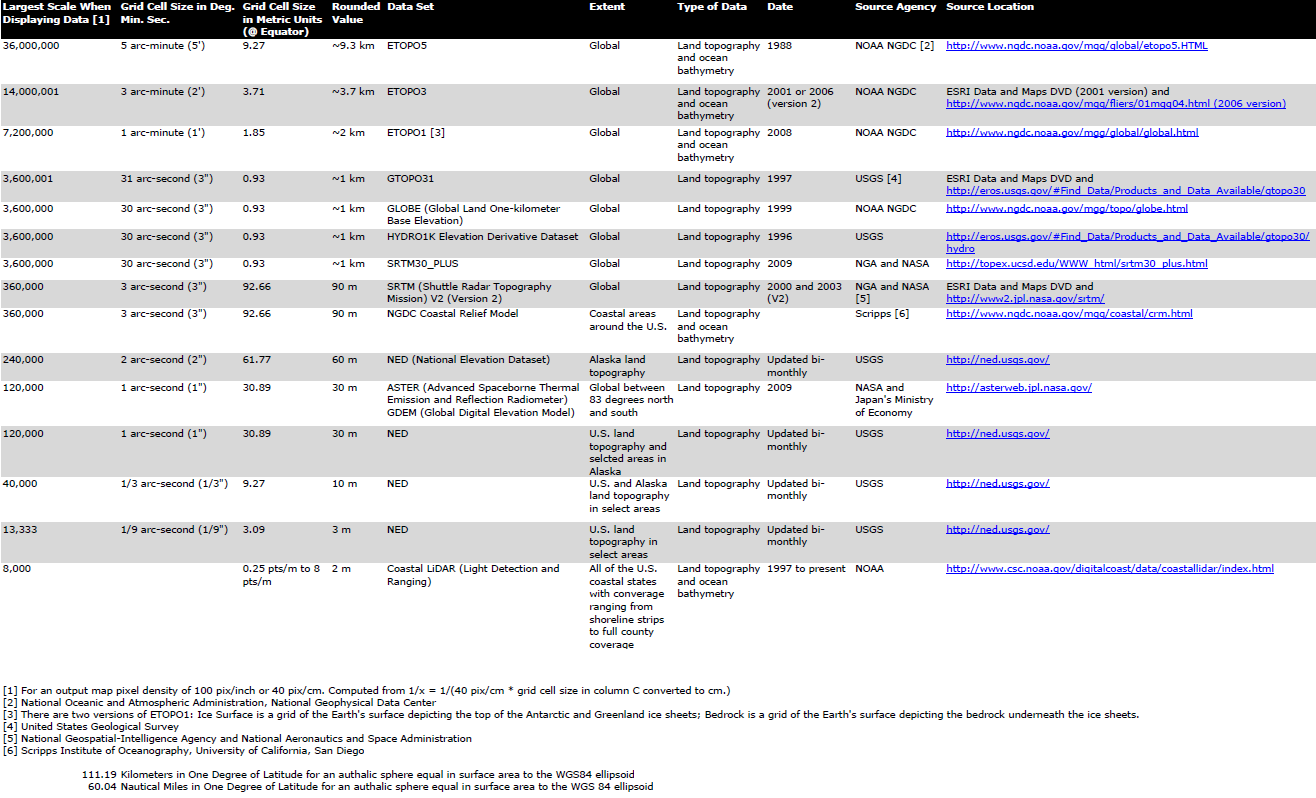
The third column in the table gives the ground resolution of a DEM cell at the equator where a cell is essentially square in shape with the same north-south and east-west ground resolution. The resolution values are either in kilometers or meters, as you can see in the fourth column that gives rounded resolution values. The values in the third column were computed based on an authalic sphere equal in surface area to the WGS 84 ellipsoid, as explained in a note at the bottom of the table. The equator is used in the computations not only because DEM cells are square like the pixels displayed on the output map, but also because the equator is the only latitude where the ground resolution of DEM cells is the same in the north-south and east-west direction s. Recalling that longitudinal spacing decreases from the equator to the pole, you can reason that the east-west ground resolution of DEM cells increases as the pole is approached (according to the cosine of the latitude)and is greatest at the equator.
The maximum advisable map scales in column 1 are computed using the equation above for an output map display pixel density of 100 pixels/inch or 40 pixels/cm. Cartographers have long known that this density or higher produces a visually smooth image where individual pixels cannot be distinguished. With coarser resolutions of 72 pixels or less the raster map becomes progressively more pixelated, undesirable from a cartographic viewpoint, as you can see in the map examples below. The equation used is linear, however, so that you can determine the largest advisable map scale for other output map pixel densities as a simple proportion of your desired pixel density divided by either 100 or 40 depending on whether your density is in inches or centimeters.
![]()
Let’s take the first entry in the table, ETOPO5, as an example. The north-south and east-west ground resolution at the equator is 9.27 kilometers (9.27 x 105cm) on the authalic sphere. At a map output display density of 40 pixels/centimeter, a pixel on the equator will represent 9.27 kilometers on the ground at a map scale of 1:36,000,000. This is the ideal situation where there is neither over- nor under-sampling of the DEM. A smaller map scale results in over-sampling of the DEM which is acceptable since more than one DEM cell falls within the ground area represented by a pixel on the map display. A larger map scale results in undesirable under-sampling — use of the same DEM cell for more than one output map pixels.
This example assumes that the map projection used has its line of tangency on the equator so that projection distortion is not an issue at the equator. Scale variation across the map surface is certainly a complicating factor and one that has been discussed for several projections in an earlier blog titled Mathematical Relationships among Map Scale, Raster Data Resolution, and Map Display Resolution. Nevertheless, the table presented here gives you good advice on appropriate map scales for a variety of DEMs.
Thanks to Aileen Buckley, Mapping Center Lead, for her help with this blog entry!
Article Discussion: