By Aileen Buckley, Mapping Center Lead
In my last blog entry, I talked about curvature surfaces – what they are, and how they can easily be created from DEMs. Now let’s see how you can use these in ArcMap to emphasize terrain representation.
In the Understanding curvature rasters blog entry, I noted that using curvature rasters with hillshaded surfaces helps to capture local variations which is useful to show areas of rapid change in slope or aspect.
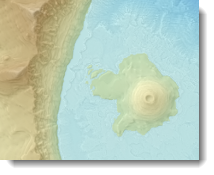
In the example we will see here, curvature rasters will help us to better see the detail in the high slope areas along the rim of the caldera that confines Crater Lake. This escarpment is one of the most interesting aspects of the terrain, yet default hillshade techniques are unable to capture the complexity of the surface. Using vertical exaggeration when creating or displaying the hillshade might work, but then the display gives a false impression of the absolute elevations of the surface. In the maps shown here, you will see that curvature rasters help us to display these terrace and ridge/valley edges as more continuous and discernible features, allowing improved visualization of the terrain surface.
A VERY IMPORTANT TIP for symbolizing these and other continuous rasters, like DEMs and hillshades, is to set the display resampling method to Bilinear Interpolation – this will eliminate any pixellation in the display of the rasters (figure 1). All of the maps in this blog entry use this method of display resampling.
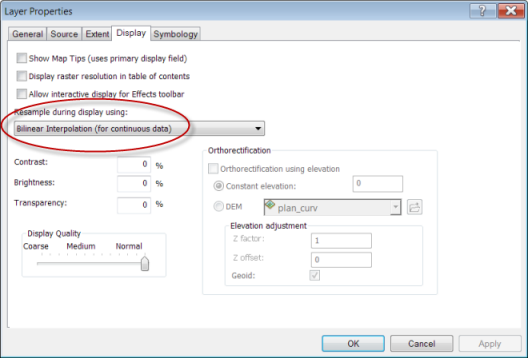
Figure 1. Setting the display resampling to Bilinear Interpolation
Let’s start with a default hillshade of the surface (figure 2).
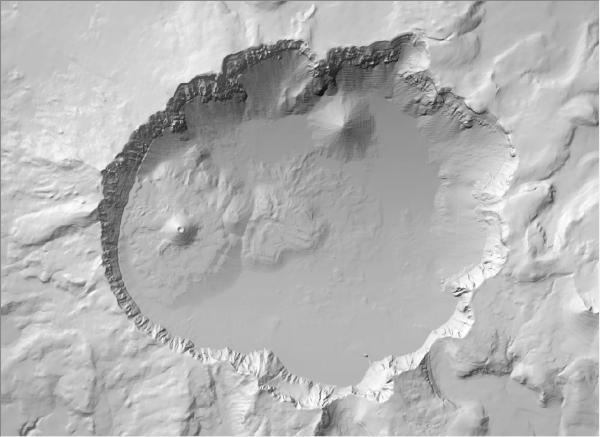
Figure 2. The default hillshade
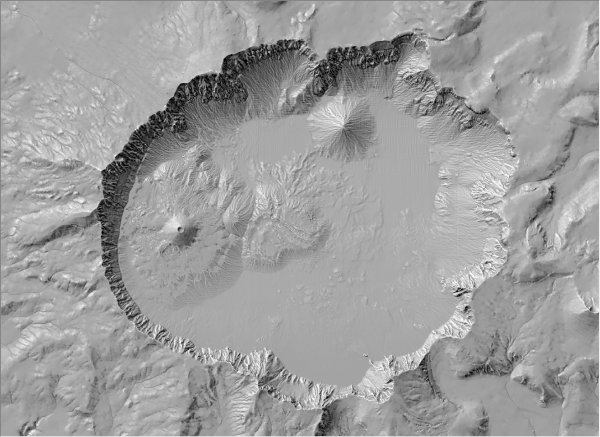
Now let’s add the profile curvature so that we see the terraces a little better. I simply displayed the hillshade with 20% transparency over the profile curvature raster with no transparency (figure 3).

Figure 3. The profile curvature raster displayed along with the hillshade
To emphasize the ridges and valleys, we can use the plan curvature raster instead of the profile curvature raster. Here I displayed the hillshade with 30% transparency over the plan curvature raster with 50% over the profile curvature raster with no transparency (figure 4).
???Figure 4. The plan curvature raster displayed along with the hillshade
To emphasize both ridges and valleys and terraces, we can use the curvature raster instead. Here I displayed the hillshade with 30% transparency over the curvature raster with no transparency (figure 5).

Figure 5. The curvature raster (both plan and profile curvatures together) displayed ?along with the hillshade
To exercise a little more control, we can use the separate plan and profile curvature rasters instead of the combined curvature raster. In this example, the hillshade is drawn on top with 40% transparency, the plan curvature raster is drawn under that with 50% transparency, and the profile curvature is drawn on the bottom with no transparency (figure 6).
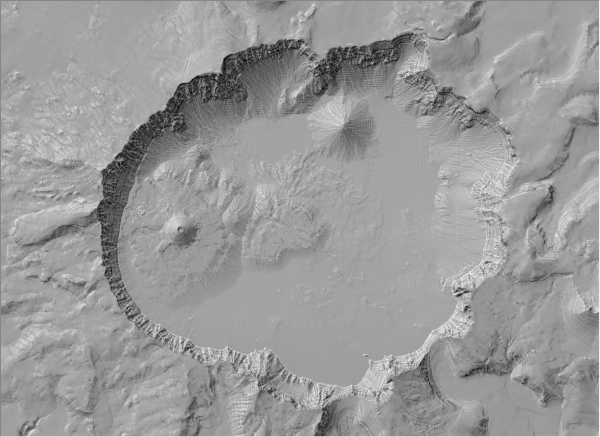
Figure 6. The separate plan and profile curvature rasters displayed along with the hillshade
Of course, you may also want to see what the curvature surfaces look like with a hypsometric tint overlaid to show elevation ranges. The hypsometric tint I used was selected from the ColorRamps 2.0 style that you can download here on Mapping Center. For comparison, below is a map that shows the hypsometric tint and the hillshade only (figure 7).
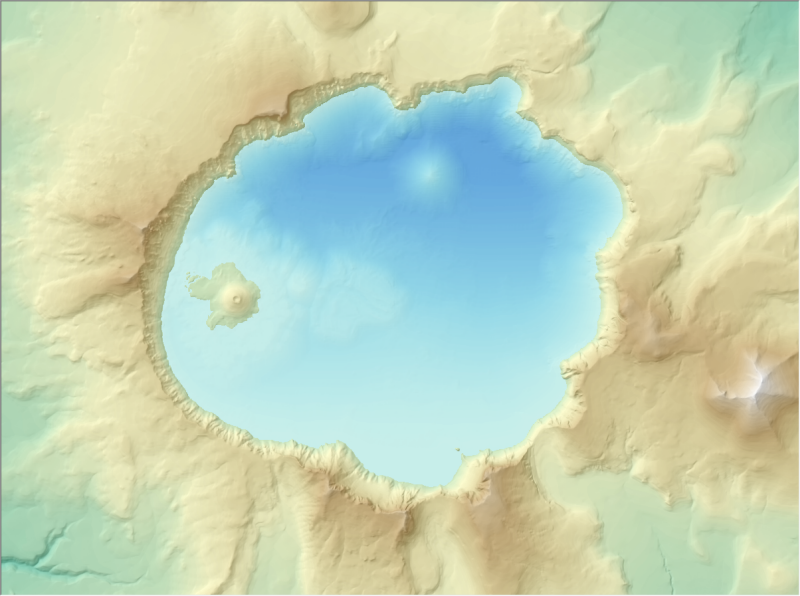
Figure 7. The separate plan and profile curvature rasters displayed along with the hillshade and overlaid with a hypsometric tint
Here is a close up of the area around Wizard Island (figure 8).
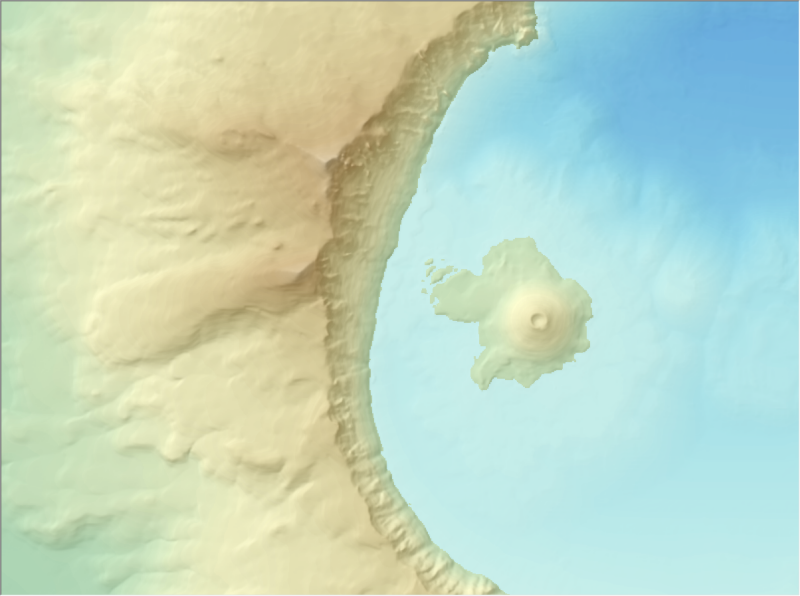
Figure 8. A close up of the area around Wizard Island
Now let’s add the curvature raster to the display. Here the hypsometric tint is shown with 30% transparency over the hillshade with no transparency (figure 9).
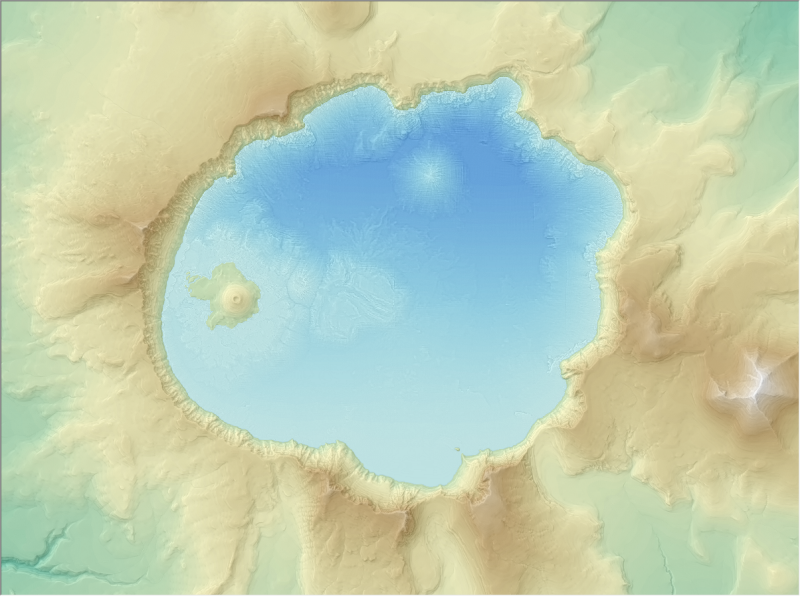
Figure 9. The results with the curvature raster added to the display
Again, here is a close up of the area around Wizard Island (figure 9). Notice on the map that the escarpment along the edge of the lake has a lot more detail. You can see both terracing and the ridges and valleys better. Also, Hillman Peak and The Watchman along the rim to the west of Wizard Island appear more pronounced, though not more exaggerated. Using curvature rasters can help to emphasize terrain features such as these without adding an inaccurate impression of amplification.
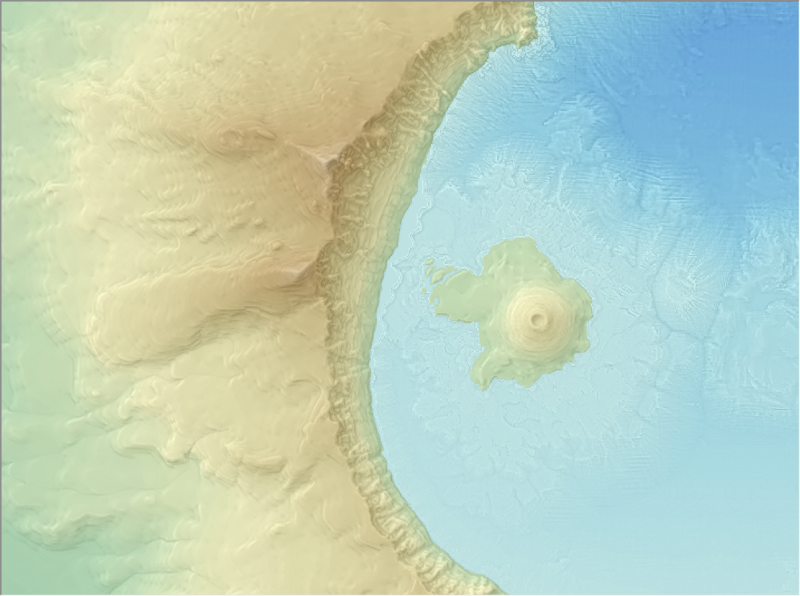
Figure 10. Another close up of the area around Wizard Island
Note that since I also have bathymetric data, I needed to display the lake are the same as the land area. Then in the last step, I simply used a color ramp of blues and set the transparency of the curvature raster to 60%.
I hope you can see how curvature rasters can be used to help you when displaying terrain surfaces. I will continue to experiment with these to see how terraces and other geologic features can be brought to life using these display techniques.
References:
Kennelly, Patrick. 2009. “Hill-shading Techniques to Enhance Terrain Maps”. Proceedings, ICC2009: The 24th International Cartographic Conference, Santiago, Chile, November 15-21, 2009. Proceedings published by the local organizing committee for International Cartographic Association. Available online at: http://icaci.org/documents/ICC_proceedings/ICC2009/html/nonref/28_8.pdf.
Kimerling, A. Jon, Aileen R. Buckley, Phillip C. Muehrcke, and Juliana O. Muehrcke. 2009. Map Use: Reading and Analysis, Sixth Edition. Redlands, CA: ESRI Press, 493 pages, ISBN: 978-1-58948-190-9.


Article Discussion: