In an earlier post we covered how you can choose from a variety of JavaScript sample applications to create custom web apps using any ArcGIS Online map. In this post we’ll take a closer look at one of those samples, one that enables you to add data from any CSV file to any ArcGIS Online map.
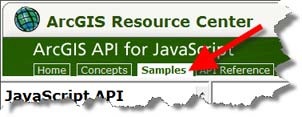
First we’ll need to download the sample. Navigate to the ArcGIS JavaScript API resource center and click the samples tab:
Scroll down along the folders on the left, open the ArcGIS.com folder, and look for the “Map with csv data” sample:

On the sample page you’ll find a link to open a live app, additional information on how to customize the sample, and a link to download the source.
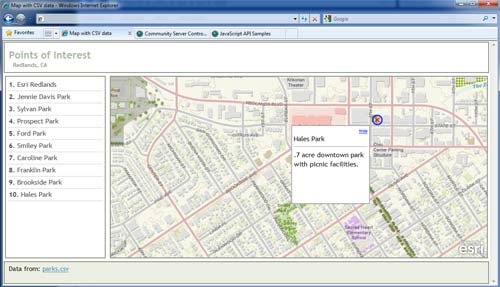
Below we’ve downloaded the source files, copied them to our website, and opened the application. The sample opens a CSV file of parks in Redlands, California, and uses the lat/long location in the CSV file to place points on the ArcGIS Online map. Click on a park in the contents or on the map to view more details in a popup window. The locations, names, and other information have come from the CSV file.
We’ll use this sample and modify it to use our own map and CSV file.
First we authored a new ArcGIS Online map by opening the ArcGIS.com viewer and added the USA Social Vulnerability Index map service. We switched basemaps to the Shaded Relief basemap (found on the basemap gallery) and adjusted the transparency of the social vulnerability layer to about 50% so we could see the terrain. We then saved our map, and shared it publicly.
Note that when you save a map it is assigned a unique map ID, and every map has one. You’ll see the map ID in the URL when you open a map, as shown below:
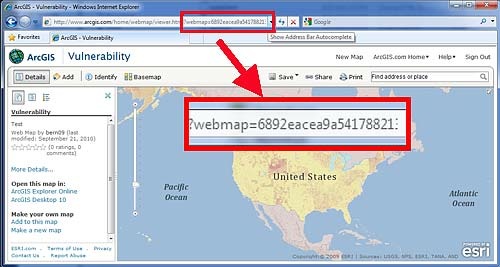
We’ll use this map ID when we edit the sample code.
Next we’ll need a CSV file. We visited the USGS earthquake site and downloaded a CSV file of magnitude 1+ earthquakes in the past hour. Here’s the CSV file, and note that the field names are in the first line of the file. We’ll use the file and field names when we edit the sample code.
Src,Eqid,Version,Datetime,Lat,Lon,Magnitude,Depth,NST,Region
ak,10082028,1,”Tuesday, September 21, 2010 22:39:21 UTC”,61.1078,-150.2322,1.6,47.10,10,”Southern Alaska”
nn,00316975,7,”Tuesday, September 21, 2010 22:24:49 UTC”,36.9602,-116.1745,1.5,8.30,10,”Nevada”
ak,10082020,1,”Tuesday, September 21, 2010 22:21:19 UTC”,61.1159,-150.2703,1.1,38.90, 8,”Southern Alaska”
ak,10082008,1,”Tuesday, September 21, 2010 22:07:32 UTC”,60.1867,-152.5540,2.2,103.00,22,”Southern Alaska”
ci,14845636,2,”Tuesday, September 21, 2010 22:00:03 UTC”,33.4480,-116.5805,1.2,13.40,38,”Southern California”
We copied the CSV file to the same location as the rest of the source files we downloaded, and here’s the contents of the folder now:
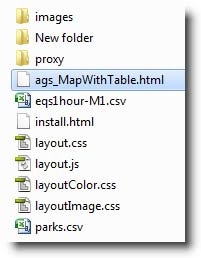
We’ll edit the ags_MapWithTable.html file (highlighted in blue above). The eqs1hour-M1.csv file found below it is the file we downloaded from the USGS site with earthquake information.
We made the changes below highlighted in bold text. All of these edits are made to the init() function found in the html file:
//The ID for the Map from ArcGIS.com
agoId = “d5e02a0c1f2b4ec399823fdd3c2fdebd“;
//Path to the CSV file
dataUrl = “eqs1hour-M1.csv“;
//List of fields that includes the label field, latitude field and longitude field.
defaultFields = [“Region”, “Lat”, “Lon”];
//The default look of the info template. In this snippet the location field will be used
//for the title and the details field will populate the info window.
defaultInfoTemplate = “${Magnitude}<br /><hr>${Region}<br />${Datetime}”;
//The title, if not specified the webmap’s title is used
title = “Recent M1+ Earthquakes“;
//The subtitle, if blank the description of the first layer in the webmap is used.
subtitle = “USGS Earthquake Data“;
//If the webmap uses Bing Maps data, you will need to provide your bing maps key
bingMapsKey = “”;
//The size of the popup window
popupSize = “175,175″
//The default location of the popup
layout=”left”;
//Uncomment this line if the proxy file is not on the same domain as the application
//proxyUrl = “/proxy/proxy.ashx”;
//Default colors for the symbols
defaultSymbols = “rgba(255,0,0,0.75);rgba(0,0,255,0.75)”;
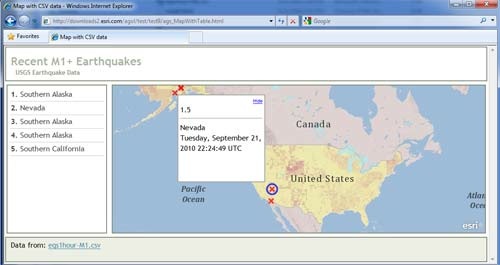
Here’s a summary of the changes to make: insert a new map ID, change the name of the CSV file, change the field names used in the defaultFields and defaultInfoTemplate (popup window) lists, and change the title and subtitle – all very easy and straightforward edits. Now we’re ready to open our custom application.
Here’s our custom app, showing recent earthquakes from the CSV file with our social vulnerability map:

Commenting is not enabled for this article.