There are some great enhancements in ArcGIS 10 that work in conjunction with data driven pages and make it possible to create dynamic locator maps and add some interesting page effects to your map books.
A new data frame extent option, Other Data Frame, has been added that makes it possible to synchronize the 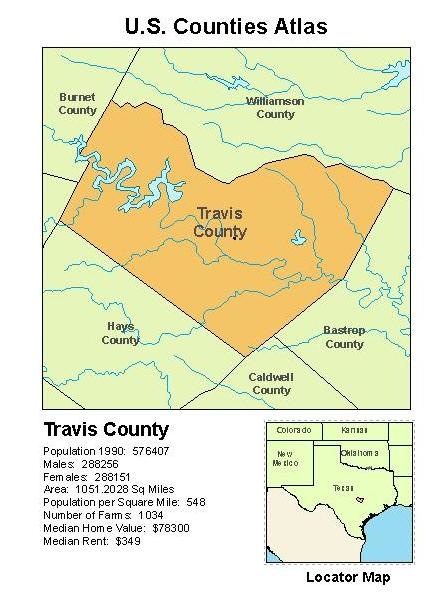 extent of your main data frame with the extent of one or more additional data frames. If you pan and zoom in the main data frame it will automatically pan and zoom in the additional data frames. This can be useful if you have two themes you want to show side by side and keep the same extent in both data frames, and you can use this new extent option to create dynamic locator maps. Locator maps show a larger area than focus map, and often highlight the focus area giving the map reader a better reference to the maps location. The Other Data Frame extent option allows you to specify a margin that makes it possible to define a larger area, while at the same time having the locator map pan and zoom using the extent of the main map. You can also zoom to features that intersect the extent of the main map. For example, if you are making a County Atlas of the United States, you can add a locator map that updates its extent to the state that includes the current county. For example, if you are San Diego County, California then the locator map will zoom to California, and when you move to Travis County, Texas the locator map will automatically zoom to Texas. To learn more about the new map extent options see the Desktop help.
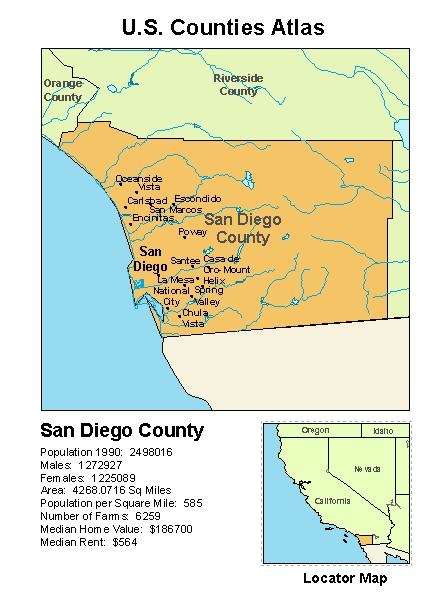
There are also some additional ways to highlight the main map in your locator map. If you are using data driven pages you can highlight the extent using the shape of the index feature. This is the new default when using an Extent Indicator. This used to be the Extent Rectangle, but this new functionality means you can use any feature shape, so the rectangle part didn’t make sense any more, but you can still use the extent rectangle by selecting the “Use simple extent” option. Since you can use the shape of the data driven page index feature, you can do more than just outline the extent, you can give the entire shape a different color by going into the frame properties and defining a background color. To learn more about extent indicators see the help topic.
There are other enhancements that make it possible to add some new page effects to highlight the current data driven page. Clip to Shape has a new option to use the data driven page index feature’s shape and another new option to allow you to exclude individual layers from clipping. This makes it possible to only clip the layers you want, while allowing other layers extend to the edge of the data frame. This means no more empty white space around your Clip to Shape extent, and it also makes it possible to highlight the current page by displaying the index feature area in a different color. To learn more about the new Clip to Shape options see the help topic.
There is also a new Page Definition Query that can be added to your Definition Queries when working with data driven pages. The page definition lets you filter features that have attributes that either match, or don’t match the name of your data driven page index feature. This makes it possible to include features, or not include features, based on the current page. For example, many atlases require an overlap area between pages and unique annotation is required for each page where the text has been moved to avoid being clipped at the edges. By attributing the annotation with the associated page name, you can use a Page Definition Query to only show the annotation that belongs to the current page. To learn more about page definition queries see the help topic.
Content provided by David Watkins
See recent post on Data Driven Pages

Commenting is not enabled for this article.