By Charlie Frye, Esri Chief Cartographer
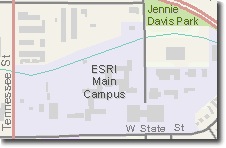
From time to time we’ve had to create some building footprint data. A colleague was in my office yesterday looking at the map to the right, and remarked that he thought that adding building footprints to maps “humanizes” the map. An interesting observation, and one that I’m not inclined to argue against.
We’ve learned a few tricks for making haste with little or no waste to produce building footprint data. The premise is that you’re starting with a properly rectified ortho-image base (it’s also helpful if your elevation base is rectified the same way–it makes the ensuing cartographic products look much better).
First, get your data model sorted out. For building footprints, we use a polygon feature class that typically has two essential fields:
- Name: [type = TEXT, length = 64]
- BldgType: [type = LONG INTEGER] We typically have a coded value domain on this field doing something like: 0 = General Case, 1 = Commerical – Retail, etc. We have categories for: Education, Industrial, Religious, Healthcare, etc. Many places use their zoning codes as a starting point for setting this up. One tip is to set the default value to your most common type of building, e.g., “General Case”.
Second, set up ArcMap so you can easily use the tools you’ll need most. The key is to quickly produce lots of buildings in order to avoid situations where you have to drag your mouse all over your screen for common tasks, and to minimize mouse clicks for common tasks. To do this create a new custom toolbar, here is a good set of tools to start with:
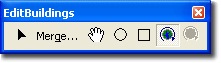
All of these tools are already in ArcGIS, in these Categories on the Customize dialog’s Commands tab: Editor, Advanced Editing, or Pan/Zoom. The idea is that this toolbar floats inside of the data view of ArcMap, close to where you’re editing–minimizing the distance of the cursor to whatever you need next.
Editing Methods & Tips:
- Since most buildings are rectangles or composed of rectangles, rotate your data frame so that your imagery shows the buildings as horizontally oriented. Now you can use the rectangle tool to create a new features. This ensures you have right angles where right angles ought to be. Don’t waste time using the Sketch tool trying to do vertex by vertex data entry.
- Many buildings are a combination of rectangles. You can quickly digitize overlapping rectangles that cover a given building; to complete the building, select all of the buildings, and then Click Merge–having the custom toolbar is a big time saver here.
- Set your snapping environment to snap to building vertexes and edges. You’ll find it easier to create “L” shaped buildings if you can snap to the outside corner of the “L”. You can follow the same logic to create buildings with complex shapes as well.
- Use the Circle tool to create curves that are parts of circles. This works well since most curves on buildings are based on circles (the more complicated the curve, the higher the construction cost). You can either snap to tangent points on circles, or complete circles by snapping to corner vertexes.
- For buildings with angles that the rectangle tool doesn’t easily handle, first try using the rectangle tool where you can–rotate your data frame one or more times to make this easy. Otherwise use the Sketch tool to create triangles that snap to your rectangle’s corners.
Using these methods to create buildings makes it possible to create hundreds of buildings in less than an hour.


Article Discussion: