By Charlie Frye, Esri Chief Cartographer
Which are the 30 or 500 most important of Minnesota’s famous 10,000 lakes? Next, think about that question from the point of view of making a zoom-able map of the U.S. and how many lakes need to be shown as you zoom in. That question boils down to how to decide which polygons to show. Not all polygons are created equally, some are roughly round, some are banana shaped (like ox-bow lakes) some have lots of prongs (like a reservoir formed by U.S. Army Corps of Engineers dam), some are long and twisty like a pretzel.
The USGS’s guidance for selecting polygons from their 1:24,000 scale maps to be included on the 1:100,000 scale maps was based on the width of the smallest axis of a polygon. That worked well back in the days when folks used their eyes and hands to make maps. For the modern cartographer databases, keyboards, and mice effectively blunt the senses and the mapmaking process.
A little over a year ago I took the essence of that USGS guidance and decided to see how far I could push it. The result is a Python script tool (Minimum Bounding Rectangle Polygon Analyzer) that analyzes polygons and a method for selecting polygons based on that analysis.
The analysis depends on creating the smallest minimum bounding rectangle (MBR) around a polygon and analyzing the rectangle and the polygon’s relation to it. This provides three measures that prove very useful in selecting polygons for smaller scales
- Area of the polygon, which is essentially a starting point, after all there is no point in analyzing polygons that are way too small in the first place.
- Percentage of the area of the MBR that the polygon occupies. This indicates how substantial the polygon is. The MBR Polygon Analyzer script adds a field called MBR_Area to your polygon data to store this information.
- Ratio of the length to width of the MBR. This indicates whether the polygon is generally long. For instance a 20:1 ratio indicates a long polygon, while a 2:1 ratio indicates a round-ish polygon. The MBR Polygon Analyzer script adds a field called RatioL2W to store this information.
There seem to be four basic types of polygon shapes that need to be worried about (these can be subdivided, but I found after working with seven, and then five, that I was just repeating essentially the same work by having more classes). Here are examples of query where clauses for each type of shape:
- Roundish: RatioL2W less than 1:5 AND MBR_Area greater than 40%
- Oblong: RatioL2W between 1:5 and 1:12.5 AND MBR_Area greater than 30%
- Long: RatioL2W greater than 1:6) AND MBR_Area between 6% and 30%
- Pronged: RatioL2W between 1:2 and 1:20 AND MBR_Area” greater than 5%
These queries logically leave some gaps, but when combined with a minimum threshold for feature area, manage to select all the expected features in testing thus far. For instance, here is a definition query I used not long ago to select lakes from a NHD Medium resolution water bodies dataset to be included on a 1:250,000 online map:
(“AREASQKM” > 1 AND ( “RatioL2W” < 5 AND “MBR_Area” > 40)) OR (( “AREASQKM” > 2) AND (“RatioL2W” >= 5 AND “RatioL2W” < 12.5) AND “MBR_Area” > 30) OR (( “AREASQKM” > 3) AND (“RatioL2W” < 6) AND (“MBR_Area” > 6 AND “MBR_Area” < 30) ) OR ((“AREASQKM” > 2) AND (“RatioL2W” >= 6 AND “RatioL2W” < 20) AND (“MBR_Area” > 5))
While most of the design and testing of this method has been focused on hydrographic data, some testing has been done on soils, geology, forestry, buildings, and landcover data. All show promising results.
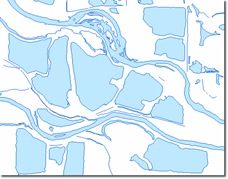
Selecting the data for a smaller scale map is only the first step. The polygon’s geometry may need to be simplified. Depending on your cartographic preference, you may want to aggregate, displace, or exaggerate some of these polygons. In fact, just to generate a little discussion, given the following example what would you do to the smaller ponds in this picture and why? Are there other things you would have done differently? Please add your responses to the comments.

Article Discussion: