By Charlie Frye, Esri Chief Cartographer
We received a suggestion to write a blog entry on this topic from Anna Schwabedal, who is a technical sales representative for Esri Germany. Anna gave us a rough idea of how this works and I was able to use that when this topic came up through Ask a Cartographer recently, and I’ve worked on it a bit since then in order to write this.
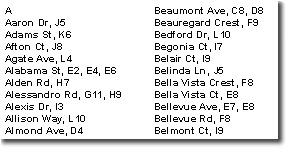
The idea is that if you have a reference grid in ArcMap (a.k.a. bingo grid or map index grid) superimposed on a street map, you should be able to create an alphabetized index of the street names along with a list of the grid cells where they can be found (like the one to the right. A map index grid graphically subdivides your map in to columns and rows; typically the columns are labeled A, B, C, D… and the rows 1, 2, 3, …
To create a street name index in ArcMap, two datasets are needed: first is an annotation feature class containing your text, and second is polygon feature class containing the map index grid. The map index grid dataset must have a field that contains the name of each grid cell, e.g., A1, B3, D8, etc.
Since the reference grids in ArcMap cannot be converted into features, another way is needed to create the grid. Use the ArcScripts sample called Create a grid polygon shapefile (FISHNET). Here is how I did it:
- Download and install the tool as instructed in the readme.txt file that is included.
- First you’ll need to provide the tool with the lower left coordinate of your data frame. The data frame tab of the data frame properties dialog has that information.
- Then the tool needs to know the size of each grid cell, and the number of rows and columns to create. The trick I use is to create a reference grid and then use that to get the size of the grid cells. The key is to temporarily set the line width of the grid lines to 0.01 points. Then, while in layout view, zoom in as far as possible on the upper right corner of the lower left grid cell. Then I put my cursor right on that intersection and look in the bottom of my ArcMap window to get the coordinates. To get the X dimension of the grid cell subtract the X coordinate of the origin from the X coordinate of the upper right of the lower left grid cell. Do the same for the Y coordinates to get the Y dimension.
- Plug the numbers into the tool and it will produce a grid dataset.
- Next add three fields to that dataset, one for Row_ID, Column_ID, and Cell_ID. These should be text fields with a width of 4.
- Used the Calculate Field tool to set the values. First select a row of grid cells calculate its row_ID to the corresponding number in your reference grid. Repeat for each row, then I do the same for the columns.
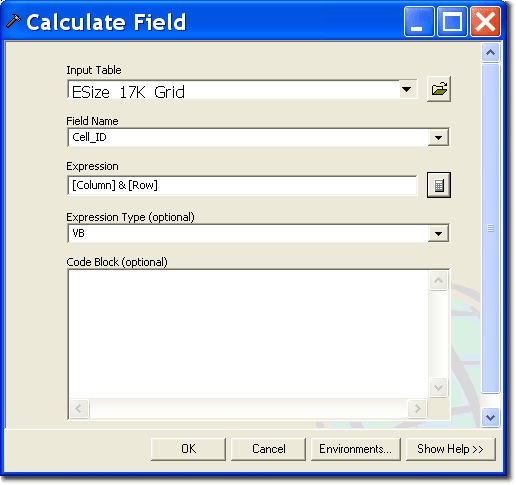
- Last, concatenate the values of the rows and columns in a Cell_ID field. (see picture)
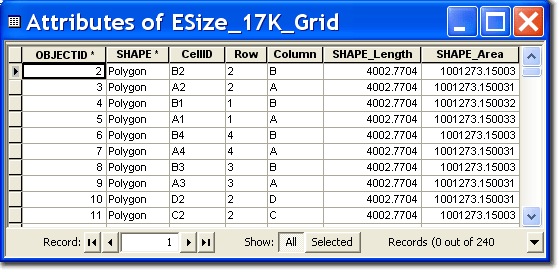
Here is what my map index grid’s table looked like (note I amended the recommended field names given above based on seeing that CellID was not so attractive as a field name below):
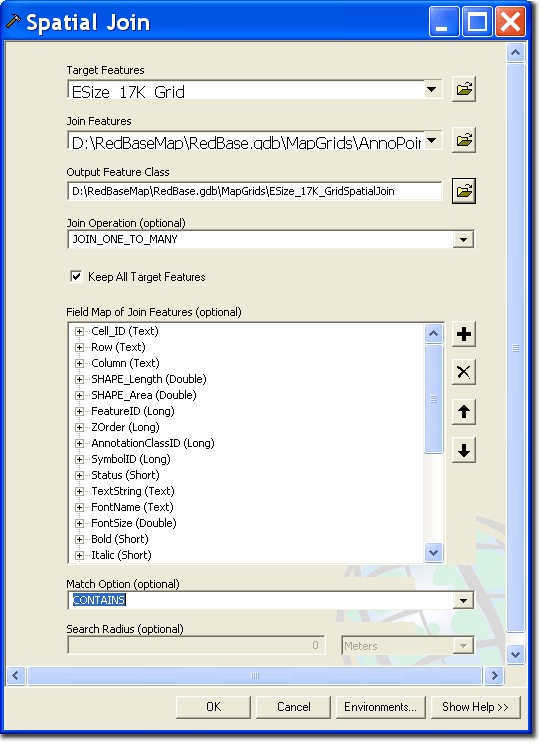
The next step is to use the Spatial Join tool (one to many is the join option) and join the annotation to each grid cell they fall within. However, you will likely not want to work directly with the annotation because the spatial join options for “contains” or “within” will not include any annotation that overlaps more than one grid cell. Further, the “intersects” option will create duplicate entries in the same circumstances. To get around that convert the annotation to point features using the Feature to Point tool (Important note: I had to delete the Element field; the type is blob, the field isn’t needed, but if it’s there, the tool won’t run).
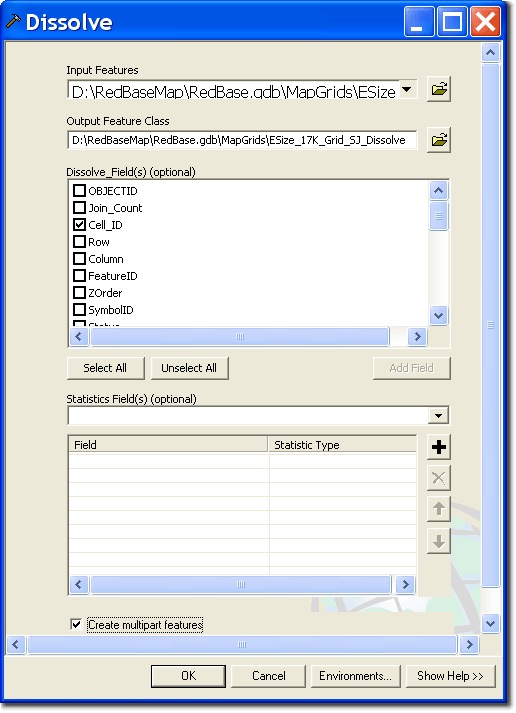
Next the result of the spatial join, which will still contain duplicates (when the same name appears two or more times in a grid cell), needs to be cleaned up. To do this, use the Dissolve tool; set the dissolve fields to be your concatenated grid cell ID and the Text String field. Uncheck the option to create multi-part features.
To create the index text, add a new text field and calculate it to be the concatenation of the street name and grid cell. My calculate statement was: [TextString] & “, ” & [CellID]; this added a comma and a space between the two.
The next step is to format the index. While it is technically possible to do this in ArcMap, the user interface is not tailored to this sort of task, which is more suited to a word processor or spreadsheet. My inclination was to export table and do this work using Microsoft Excel. Here is what I did:
- Open the result of the Dissolve tool in ArcMap.
- Open the layer’s attribute table.
- From the Options menu button choose Export.
- In the Export Data dialog box click the Output table button at the right.
- Change the format to dBase and save the file.
- That dBase file can be opened in Microsoft Excel to do the sorting and formatting.
Specifically, in Excel, I did the following:
- Delete all the fields except my concatenated index string.
- Saved the file as an Excel file.
- Sorted (from the Data menu choose Sort) the entries alphabetically.
- “Cut” the rows that contained numeric streets like “6th St” and insert them alphabetically, e.g. “6th St” went in the S’s.
- Inserted a header row for each letter in the alphabet.
- When my annotation was multiple part (stacked or otherwise), some extra characters which showed as large boxes in Excel needed to be deleted by hand.
- When the same street name appeared in two or more grid cells; I had to delete the subsequent rows and manually append the grid cell identifier to the first row for that name.
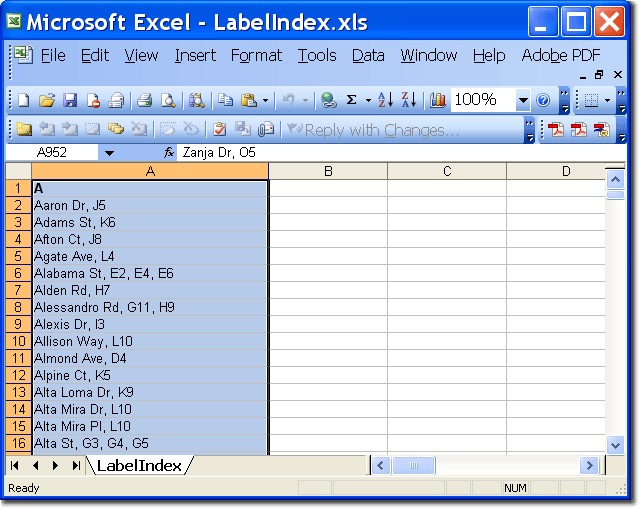
This is what my index looked like in Microsoft Excel after I had done this work:
The last step is to copy the correctly sorted and formatted index from Microsoft Excel and Paste it into ArcMap, to do that:
In Layout View, use the Rectangle Text tool on the Draw toolbar to create a new Rectangle Text Element.
- Make the rectangle text element’s extent fairly wide (explained in step 3).
- Open the properties for this new rectangle text element.
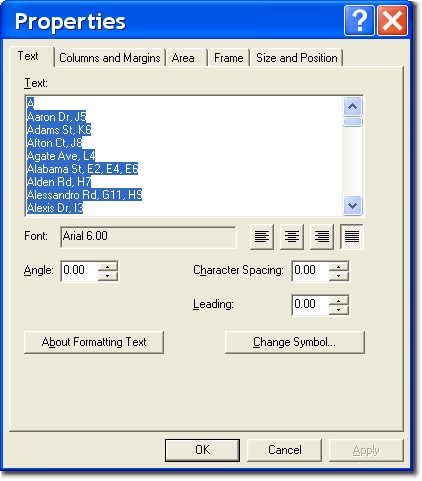
- In Excel select the column of text and click Ctrl-C to copy it. Then in ArcMap, paste your content from Excel into the text tab. Below is what your results should look like: (I got some strange results when my text element was too narrow; extra quotes, etc.)
- Set up columns in the rectangle text element (using the columns and margins tab of the properties dialog box).
I’ve tried this on a several of case study datasets I have here at Esri and this method has worked well in all cases, and was even easy to adapt to an atlas where in addition to row and column ID fields, I also added a page number field into the mix. In one example I created an index for a city of 70,000 people on a 1:18,000 scale E-size map that included 1,300 street names in about 90 minutes; this was my third trial, and I was working pretty confidently by that time, so allow yourself a bit more time as you learn.


Article Discussion: