FEATURED
Read this article
Executive-level news and actionable insights to drive growth.
Business and technology leaders discuss digital transformation and location intelligence.
Stories about the power of GIS innovation in the real world.
Practical and technical articles by and for ArcGIS users
Current GIS news and the latest ArcGIS technology updates.
GIS news, views and insights in a monthly digital publication.
WhereNext Magazine
Digital Twin Technology Brings Pompeii to Life
Podcast
Mapping Dinosaur Fossils from Dig to Display
Esri Blog
How Cisco Created a GIS-Based Digital Twin of Its Service Supply Chain
ArcUser Winter 2024
ArcUser
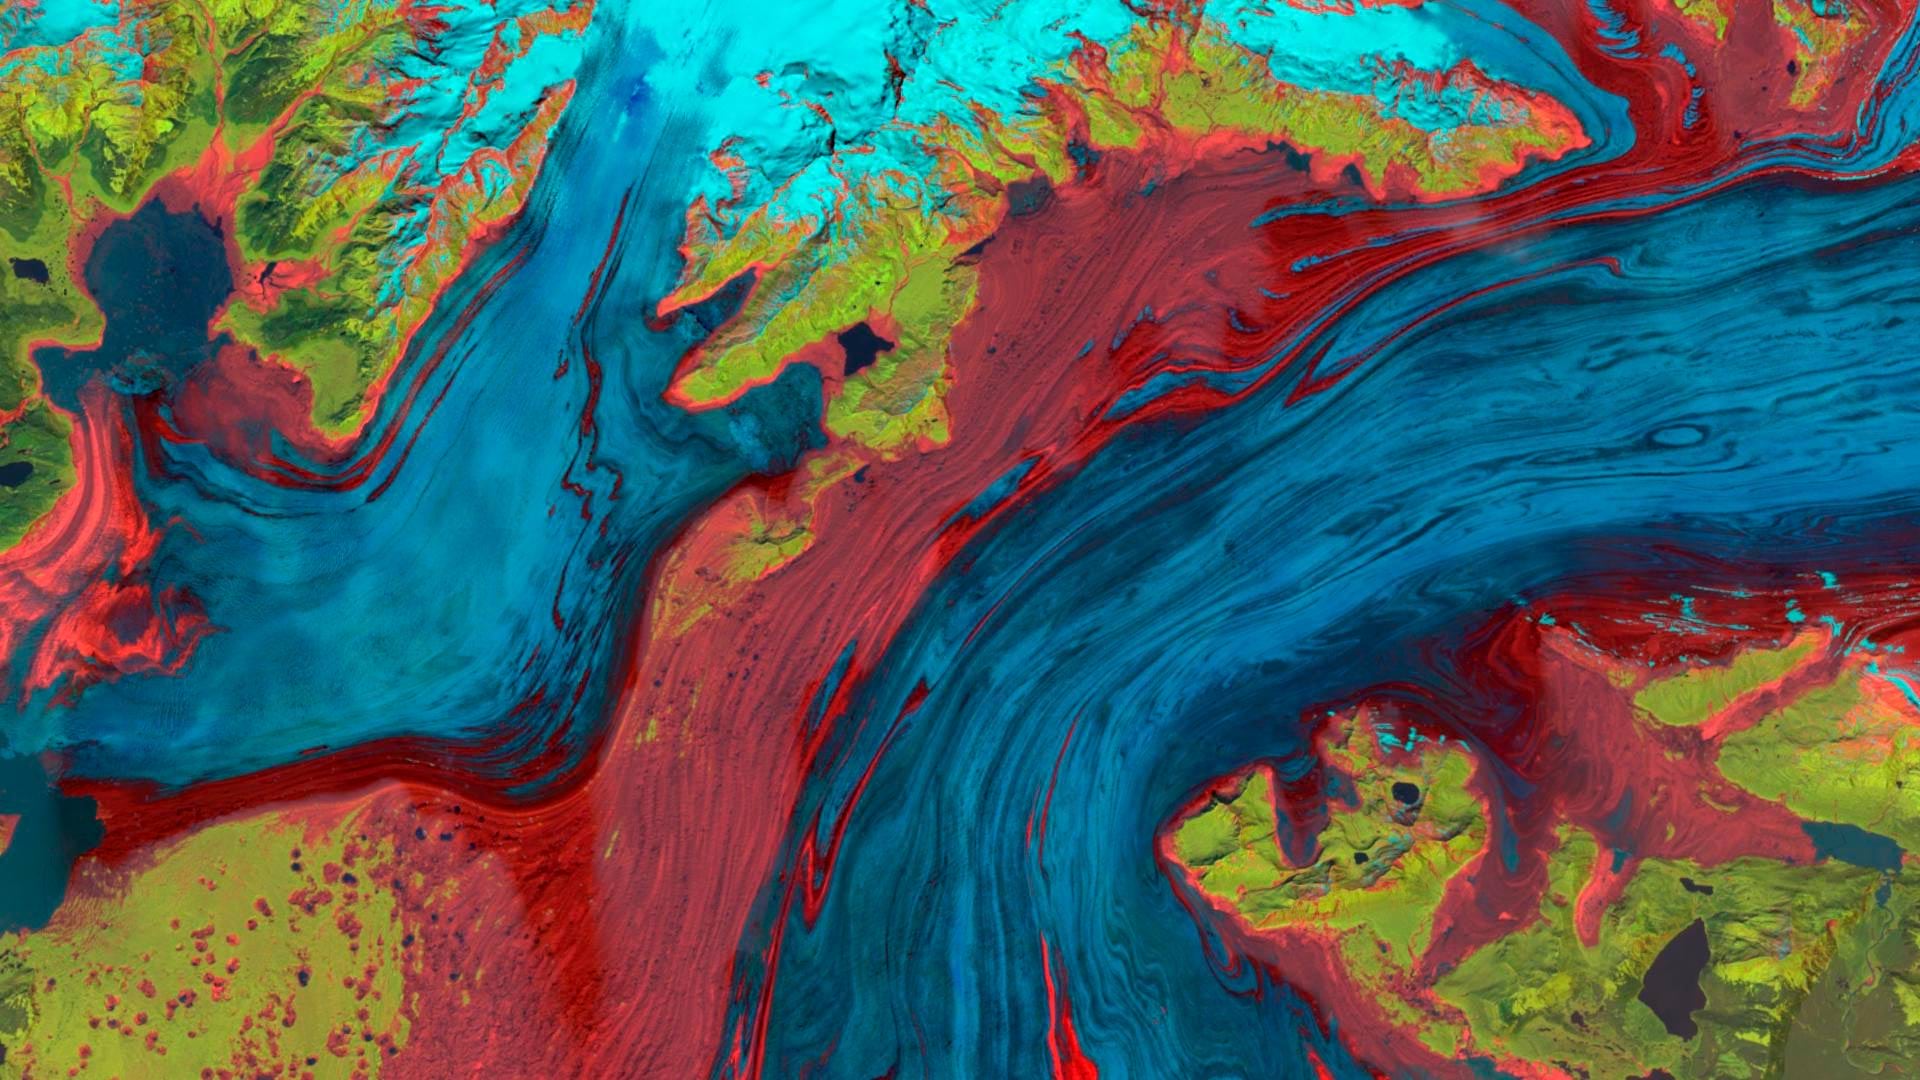
Landsat Explorer: Traversing Time and Geography with Remote Sensing
ArcNews
GIS Powers Offshore Windfarms
ArcWatch
Have an amazing story to tell?
Geographic Information Systems with Jack Dangermond
Mapping a Way to Conservation: An Interview with Jack Dangermond
Thousands Of Volunteers To Comb The Region And Tally The Number Of Unhoused People
announcement
Esri Releases Latest Land Cover Map with Updated Sentinel-2 Satellite Data
Esri’s ArcGIS Basemaps Integrated into Autodesk Civil 3D and AutoCAD
About ArcGIS
What is GIS
About Esri
Events
ArcGIS Living Atlas