FEATURED
Read this article
Executive-level news and actionable insights to drive growth.
Business and technology leaders discuss digital transformation and location intelligence.
Stories about the power of GIS innovation in the real world.
Practical and technical articles by and for ArcGIS users
Current GIS news and the latest ArcGIS technology updates.
GIS news, views and insights in a monthly digital publication.
WhereNext Magazine
Breaking the Bottleneck: The Tao and the Technology to Solve the Housing Crisis
Podcast
Investigating the Human Toll of Boko Haram with Maps and Satellite Images
Esri Blog
How Cisco Created a GIS-Based Digital Twin of Its Service Supply Chain
Nature-Based Solutions Aim to Fortify Point Hope
ArcUser
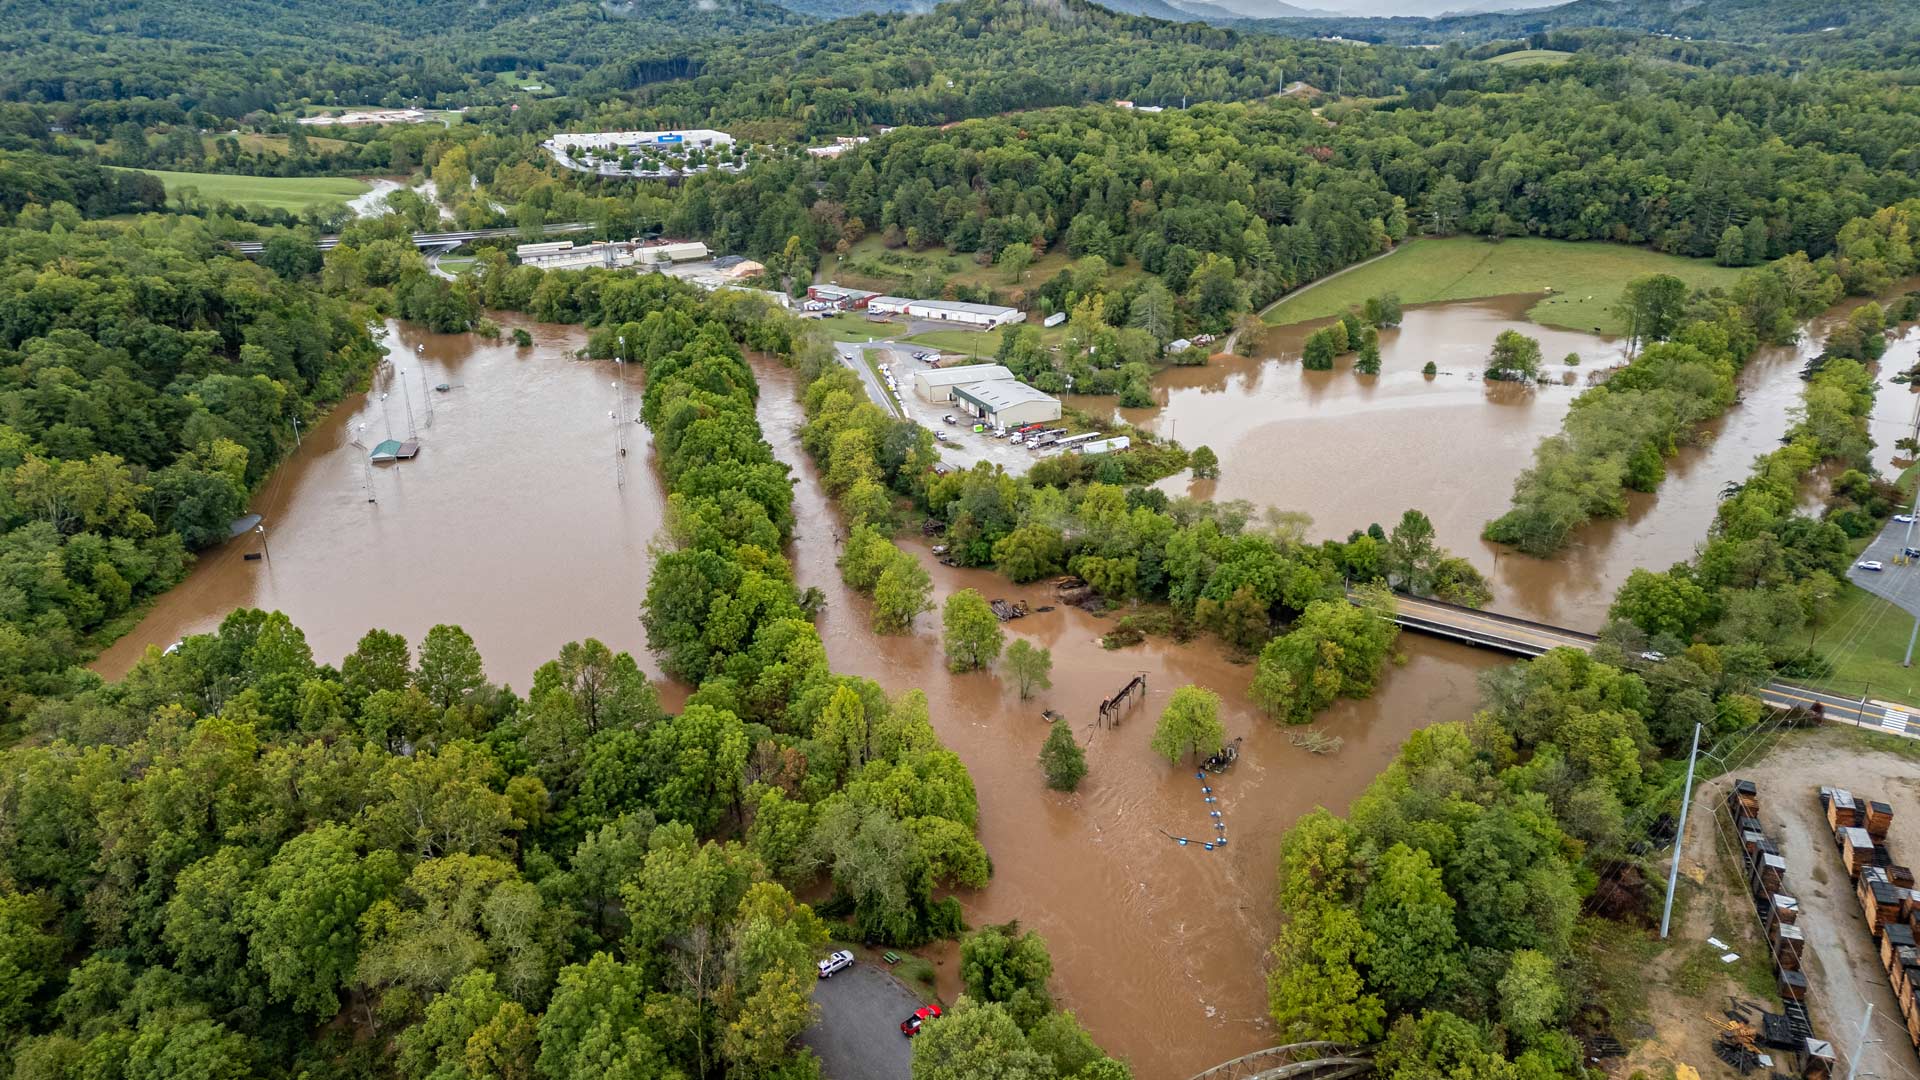
Navigating Devastation: GIS Aids Hurricane Helene Response
ArcNews
Mapping Sustainability: How GIS Transformed a Gas Producer’s Reporting
ArcWatch
Have an amazing story to tell?
How property revaluation helped one WNC county recover from Helene
Jack Dangermond: TIME100 Climate 2024
50 years of geographic insight: An interview with Jack Dangermond on Esri’s journey and the future of GIS
announcement
Esri Recognizes Partners for Innovation and Excellence
Esri Collaborates with Google Maps Platform to Offer High-Quality Photorealistic 3D Tiles
About Esri
Learn about Esri's geospatial platform
What is GIS
Events
ArcGIS Living Atlas